

Repaints MTF RSI of Symbol For ThinkOrSwim

Repaints

dart966

Member
VIP
Note this indicator will REPAINT due to the nature of getting data from a higher time-frame. Repaints until the selected aggregation's time period ends.

MTF RSI of Symbol (default = VIX):

Code:
# MTF RSI of Symbol
# by dart966 on 6.7.2025

declare lower;
# RSI
input customSymbol = "VIX"; # User-defined Symbol
input Aggregation1 = AggregationPeriod.FIVE_MIN;
input length = 14;
input over_Bought = 80;
input over_Sold = 20;

input averageType = AverageType.WILDERS;


def price1 = close(symbol = customSymbol, period = Aggregation1);

def NetChgAvg = MovingAverage(averageType, price1 - price1[1], length);
def TotChgAvg = MovingAverage(averageType, AbsValue(price1 - price1[1]), length);
def ChgRatio = if TotChgAvg != 0 then NetChgAvg / TotChgAvg else 0;

plot RSI = 50 * (ChgRatio + 1);
plot OverSold = over_Sold;
plot OverBought = over_Bought;
plot lline = 50;

RSI.AssignValueColor(Color.RED);
OverSold.SetDefaultColor(GetColor(7));
OverBought.SetDefaultColor(GetColor(7));
lline.SetDefaultColor(GetColor(7));

# End script
 
Last edited:
Join useThinkScript to post your question to a community of 21,000+ developers and traders.

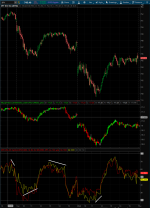
Updated this indicator to show the relationship between the RSI of SPY (normal) and VIX (inverted), which effectively tracks the typical negative correlation between equity prices and volatility in a unified oscillator view.
This can be used to spot RSI divergences in either the $SPY or VIX, especially when used in conjunction with this other indicator I created, which is attached after the modified RSI indicator.
Code:
# MTF RSI of Two Independent Symbols
# Independent Inversion Controls
# by dart966 7.8.2026
declare lower;

# --- GLOBAL INPUTS ---
input Aggregation1 = AggregationPeriod.FIVE_MIN;
input length = 14;
input over_Bought = 80;
input over_Sold = 20;
input averageType = AverageType.WILDERS;

# --- SYMBOL 1 INPUTS & CALCS ---
input customSymbol1 = "SPY"; # 'First index symbol'
input invertSymbol1 = no;    # 'Invert First Symbol?'

def price1 = if invertSymbol1 then (close(symbol = customSymbol1, period = Aggregation1)) * -1 else close(symbol = customSymbol1, period = Aggregation1);
def NetChgAvg1 = MovingAverage(averageType, price1 - price1[1], length);
def TotChgAvg1 = MovingAverage(averageType, AbsValue(price1 - price1[1]), length);
def ChgRatio1 = if TotChgAvg1 != 0 then NetChgAvg1 / TotChgAvg1 else 0;

plot RSI1 = 50 * (ChgRatio1 + 1);

# --- SYMBOL 2 INPUTS & CALCS ---
input customSymbol2 = "VIX"; # 'Second index symbol'
input invertSymbol2 = yes;    # 'Invert Second Symbol?'

def price2 = if invertSymbol2 then (close(symbol = customSymbol2, period = Aggregation1)) * -1 else close(symbol = customSymbol2, period = Aggregation1);
def NetChgAvg2 = MovingAverage(averageType, price2 - price2[1], length);
def TotChgAvg2 = MovingAverage(averageType, AbsValue(price2 - price2[1]), length);
def ChgRatio2 = if TotChgAvg2 != 0 then NetChgAvg2 / TotChgAvg2 else 0;

plot RSI2 = 50 * (ChgRatio2 + 1);

# --- REFERENCE LINES ---
plot OverSold = over_Sold;
plot OverBought = over_Bought;
plot lline = 50;

# --- COLORING & STYLING ---
RSI1.SetDefaultColor(Color.RED);
RSI2.SetDefaultColor(Color.YELLOW);

OverSold.SetDefaultColor(GetColor(7));
OverBought.SetDefaultColor(GetColor(7));
lline.SetDefaultColor(GetColor(7));

# end script


Lower Symbol Candlesticks (to invert VIX, the invert input must be yes):

Code:
# Symbol_CandleSticks_Lower
# by dart966 on 06.07.2025

declare lower;

input customSymbol = "VIX"; # User-defined symbol
#input aggregationPeriod = AggregationPeriod.FIVE_MIN;
input charttype = ChartType.CANDLE;
input invert = no;

# Retrieve OHLC data for the input symbol
def customOpen =  if invert then (open(symbol = customSymbol)) * -1 else open(symbol = customSymbol);#, period = aggregationPeriod);
def customHigh = if invert then (high(symbol = customSymbol)) * -1 else high(symbol = customSymbol);#, period = aggregationPeriod);
def customLow = if invert then (low(symbol = customSymbol)) * -1 else low(symbol = customSymbol);#, period = aggregationPeriod);
def customClose = if invert then (close(symbol = customSymbol)) * -1 else close(symbol = customSymbol);#, period = aggregationPeriod);

# Create candlesticks

# Candle/Bar trend direction logic
def UpCandle = customClose > customOpen;
def DnCandle = customClose < customOpen;
def doji = customClose == customOpen;

# GlobalColor Colors

DefineGlobalColor("UpCandle", Color.GREEN);
DefineGlobalColor("DnCandle", Color.RED);
DefineGlobalColor("Doji", Color.WHITE);

# Paint Candles using separate AddChart() function calls

AddChart(high = if UpCandle then customLow else Double.NaN, low = customHigh, open = customClose,  close = customOpen, type = ChartType.CANDLE, growcolor = GlobalColor("UpCandle"));

AddChart(high = if DnCandle then customHigh else Double.NaN, low = customLow, open = customOpen,  close = customClose, type = ChartType.CANDLE, growcolor = GlobalColor("DnCandle"));

AddChart(high = if doji then customHigh else Double.NaN, low = customLow, open = customOpen,  close = customClose, type = ChartType.CANDLE, growcolor = GlobalColor("Doji"));


# end script


1783563106496.png
 

Attachments

  • $SPY_VIX.png
    $SPY_VIX.png
    263.3 KB · Views: 7

Similar threads

Not the exact question you're looking for?

Start a new thread and receive assistance from our community.

87k+ Posts
901 Online
Create Post

Similar threads

Similar threads

The Market Trading Game Changer

Join 2,500+ subscribers inside the useThinkScript VIP Membership Club
  • Exclusive indicators
  • Proven strategies & setups
  • Private Discord community
  • ‘Buy The Dip’ signal alerts
  • Exclusive members-only content
  • Add-ons and resources
  • 1 full year of unlimited support

Frequently Asked Questions

What is useThinkScript?

useThinkScript is the #1 community of stock market investors using indicators and other tools to power their trading strategies. Traders of all skill levels use our forums to learn about scripting and indicators, help each other, and discover new ways to gain an edge in the markets.

How do I get started?

We get it. Our forum can be intimidating, if not overwhelming. With thousands of topics, tens of thousands of posts, our community has created an incredibly deep knowledge base for stock traders. No one can ever exhaust every resource provided on our site.

If you are new, or just looking for guidance, here are some helpful links to get you started.

What are the benefits of VIP Membership?
VIP members get exclusive access to these proven and tested premium indicators: Buy the Dip, Advanced Market Moves 2.0, Take Profit, and Volatility Trading Range. In addition, VIP members get access to over 50 VIP-only custom indicators, add-ons, and strategies, private VIP-only forums, private Discord channel to discuss trades and strategies in real-time, customer support, trade alerts, and much more. Learn all about VIP membership here.
How can I access the premium indicators?
To access the premium indicators, which are plug and play ready, sign up for VIP membership here.
Back
Top
