


mod note:
Instead of tiling 4 different charts across multiple monitors, this study pulls data from higher timeframes and synthesizes it directly onto a single 5-minute chart.
Core Framework
The indicator breaks down market structure across four distinct roles:
---
On-Chart Dashboard Readout
The study generates color-coded labels at the top of your chart that tell you exactly where all timeframes stand in real time:
---
How to Use It
1. Set your chart to a 5-minute timeframe. (If applied to another aggregation period, a yellow warning label will appear).
2. Look at the ACTION label first:
* If it says WAIT, the higher timeframes are in conflict, daily is neutral, or 15m is compressing. Sit on your hands.
* If it says WATCH, you have directional permission from Daily and 15M without running directly into 1H key levels. Wait for a 5M trigger bar.
* If it says CONFIRMED EXECUTE, all four timeframes are aligned, a signal arrow prints, and an alert will trigger (if enabled).
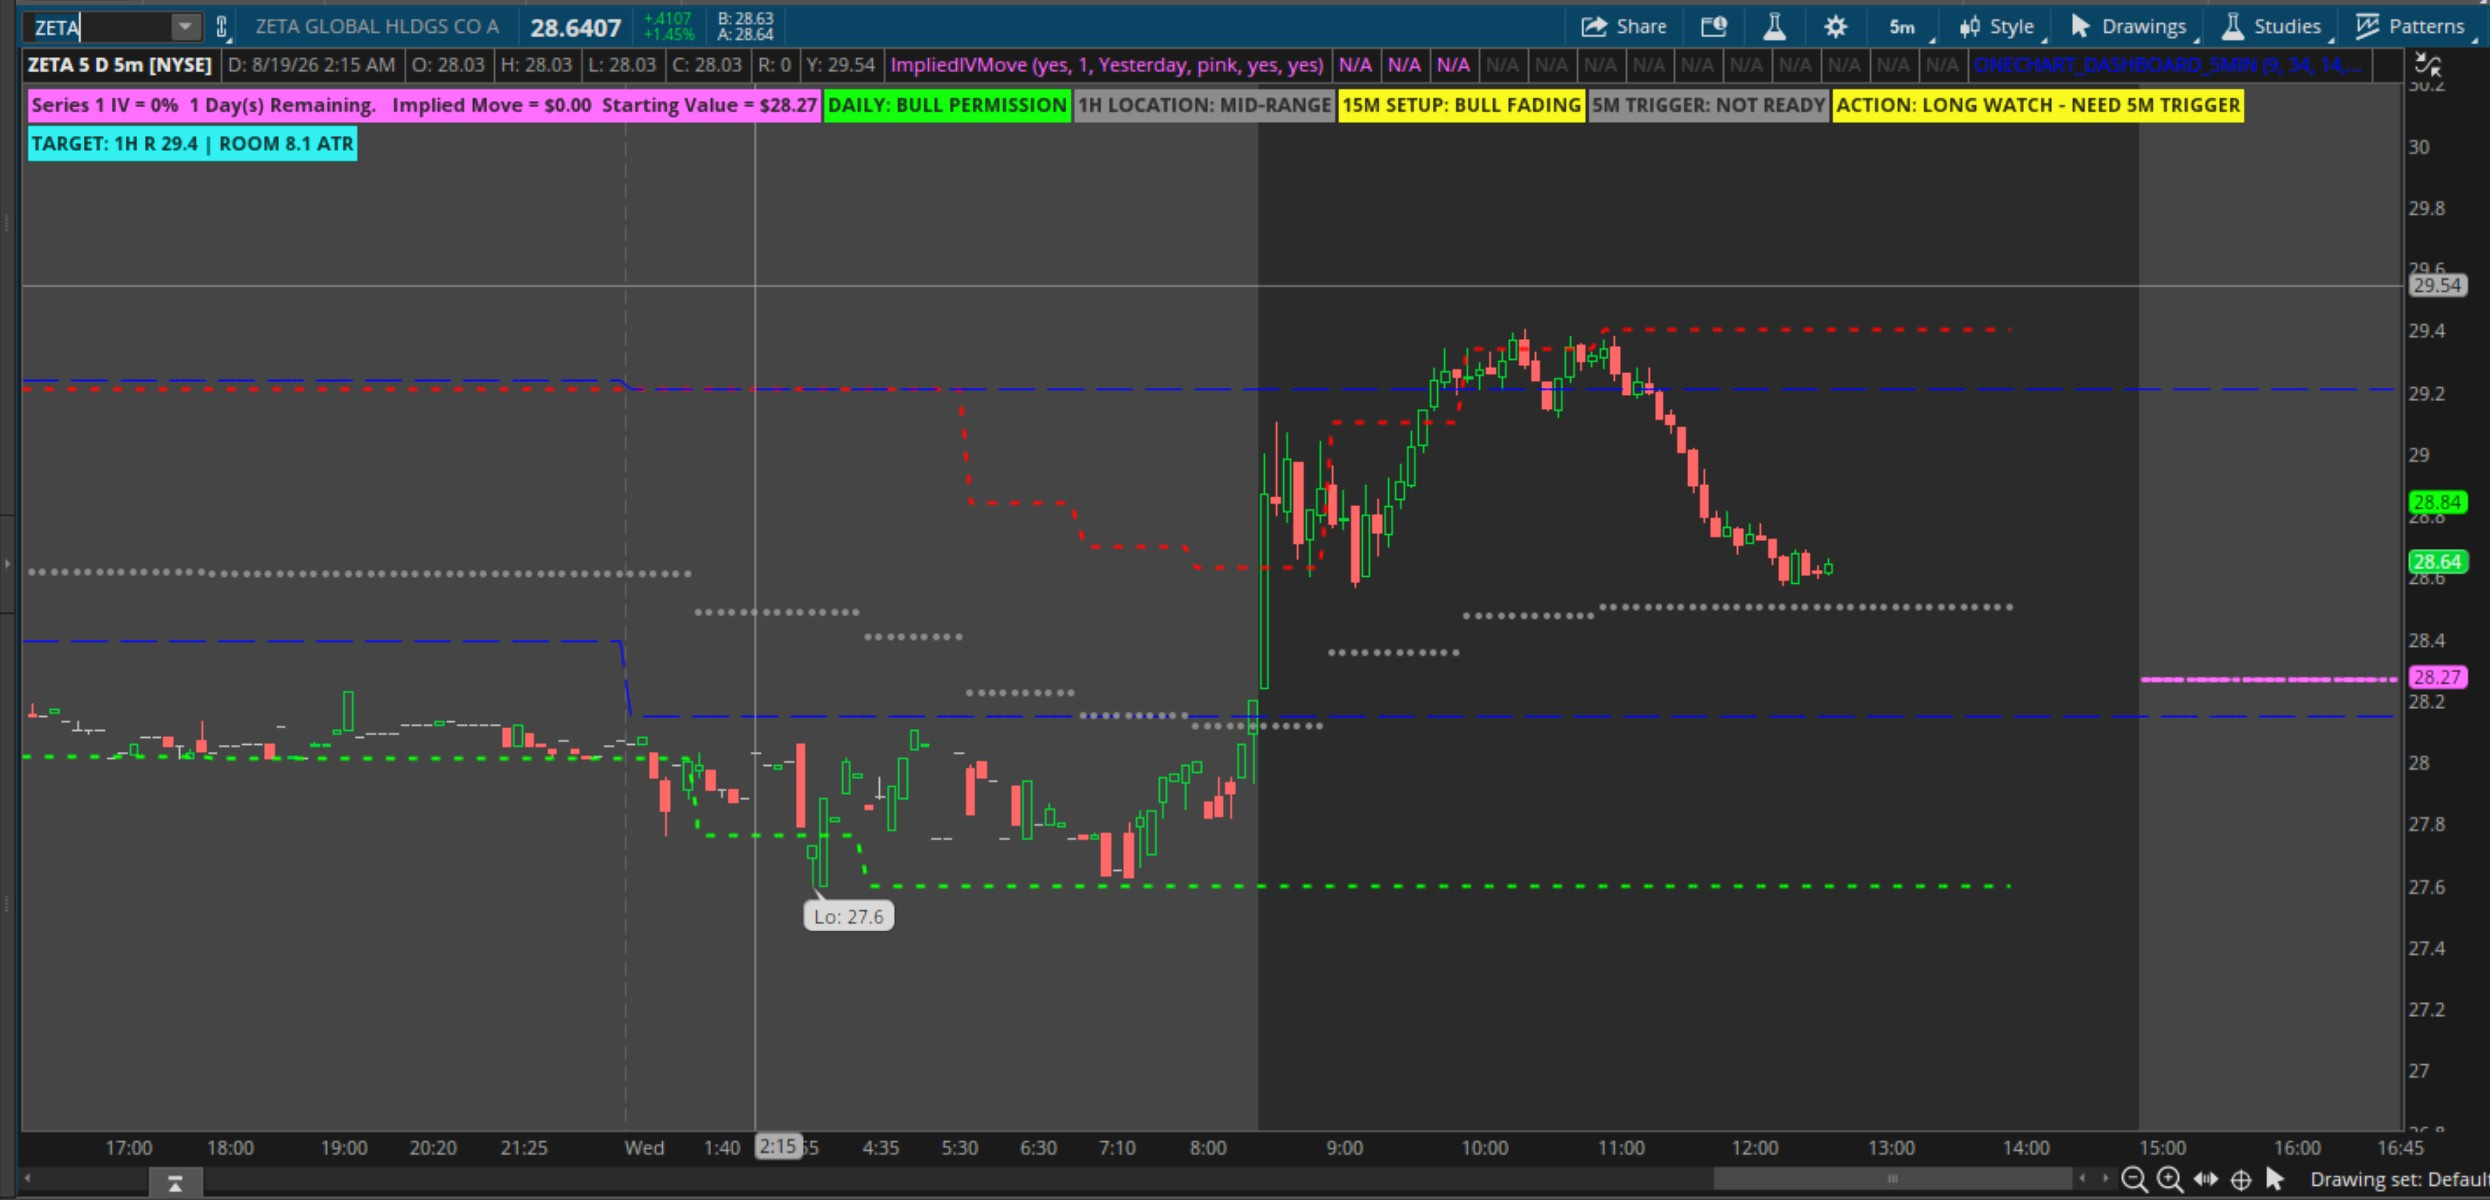
One-Chart Multi-Timeframe Decision Dashboard for thinkScript (5-Min Focus)
For use when trading a multi-timeframe framework.Instead of tiling 4 different charts across multiple monitors, this study pulls data from higher timeframes and synthesizes it directly onto a single 5-minute chart.
Core Framework
The indicator breaks down market structure across four distinct roles:
- Daily Bar = Regime (Directional Permission): Filters trades so you only trade in alignment with daily trend bias (or warns you when the daily chart is in a transition phase).
- 1-Hour Chart = Location: Maps key high/low reference levels from recent 1-hour lookbacks and calculates room to run in ATR. It prevents you from buying directly into 1H resistance or shorting into 1H support.
- 15-Minute Chart = Setup: Tracks EMA separation normalized by 15-minute ATR to determine if the medium-term move is expanding, contracting, building, or compressing.
- 5-Minute Chart = Trigger: Handles execution. Looks for price acceptance relative to VWAP and the 9 EMA, combined with a break of the prior 5-minute bar.
---
On-Chart Dashboard Readout
The study generates color-coded labels at the top of your chart that tell you exactly where all timeframes stand in real time:
| Label | What It Tracks |
|---|---|
| DAILY | Bull Permission, Bear Permission, or Transition / No Bias |
| 1H LOCATION | Shows whether price is at Support, Resistance, Lower Range, Upper Range, or Mid-Range |
| 15M SETUP | Bull/Bear Expanding, Bull/Bear Fading, Building, or Compression |
| 5M TRIGGER | Bull/Bear Break, State Wait, or Not Ready |
| ACTION | CONFIRMED EXECUTE, WATCH (Need 5M Trigger), or WAIT (Conflict/Compression) |
| TARGET | Displays distance to nearest 1H support/resistance target measured in 5M ATR |
---
How to Use It
1. Set your chart to a 5-minute timeframe. (If applied to another aggregation period, a yellow warning label will appear).
2. Look at the ACTION label first:
* If it says WAIT, the higher timeframes are in conflict, daily is neutral, or 15m is compressing. Sit on your hands.
* If it says WATCH, you have directional permission from Daily and 15M without running directly into 1H key levels. Wait for a 5M trigger bar.
* If it says CONFIRMED EXECUTE, all four timeframes are aligned, a signal arrow prints, and an alert will trigger (if enabled).
Code:
# ONE-CHART MULTI-TIMEFRAME DECISION DASHBOARD
# Designed to run on a 5-minute chart
# Daily = regime | 1 Hour = location | 15 Minute = setup | 5 Minute = trigger
# ANTWERKS 08/19/2026

declare upper;

input fastLength = 9;
input slowLength = 34;
input atrLength = 14;
input hourlyLevelLookback = 20;
input meaningfulSeparationATR = 0.15;
input compressionSeparationATR = 0.10;
input hourlyLevelToleranceATR = 0.35;
input showPriorDayLevels = yes;
input showHourlyLevels = yes;
input showSignalArrows = yes;
input showDashboard = yes;
input enableAlerts = no;

Assert(fastLength < slowLength,
       "fastLength must be less than slowLength");
Assert(hourlyLevelLookback > 1,
       "hourlyLevelLookback must be greater than 1");

def correctChart = GetAggregationPeriod() == AggregationPeriod.FIVE_MIN;

# ============================================================
# DAILY REGIME -- DIRECTIONAL PERMISSION
# Uses the developing daily bar so the label reflects today's movement.
# ============================================================
def dayClose = close(period = AggregationPeriod.DAY);
def dayHigh = high(period = AggregationPeriod.DAY);
def dayLow = low(period = AggregationPeriod.DAY);
def dayFastEMA = ExpAverage(dayClose, fastLength);
def daySlowEMA = ExpAverage(dayClose, slowLength);

def dailyBull =
    dayClose > daySlowEMA and
    dayFastEMA > daySlowEMA and
    daySlowEMA >= daySlowEMA[1];

def dailyBear =
    dayClose < daySlowEMA and
    dayFastEMA < daySlowEMA and
    daySlowEMA <= daySlowEMA[1];

def dailyTransition = !dailyBull and !dailyBear;

plot PriorDayHigh =
    if showPriorDayLevels then dayHigh[1] else Double.NaN;
PriorDayHigh.SetDefaultColor(Color.BLUE);
PriorDayHigh.SetStyle(Curve.LONG_DASH);
PriorDayHigh.SetLineWeight(1);
PriorDayHigh.HideBubble();
PriorDayHigh.HideTitle();

plot PriorDayLow =
    if showPriorDayLevels then dayLow[1] else Double.NaN;
PriorDayLow.SetDefaultColor(Color.BLUE);
PriorDayLow.SetStyle(Curve.LONG_DASH);
PriorDayLow.SetLineWeight(1);
PriorDayLow.HideBubble();
PriorDayLow.HideTitle();

# ============================================================
# ONE-HOUR LOCATION -- LEVELS AND RANGE POSITION
# Levels exclude the developing hourly candle.
# ============================================================
def hourHigh = high(period = AggregationPeriod.HOUR);
def hourLow = low(period = AggregationPeriod.HOUR);
def hourClose = close(period = AggregationPeriod.HOUR);
def hourATR = WildersAverage(
    TrueRange(hourHigh, hourClose, hourLow), atrLength);
def safeHourATR = if hourATR > 0 then hourATR else TickSize();

def hourlyResistance = Highest(hourHigh[1], hourlyLevelLookback);
def hourlySupport = Lowest(hourLow[1], hourlyLevelLookback);
def hourlyMid = (hourlyResistance + hourlySupport) / 2;
def hourlyWidth = hourlyResistance - hourlySupport;
def hourlyRangePosition =
    if hourlyWidth > 0
    then (close - hourlySupport) / hourlyWidth
    else 0.50;

def nearHourlySupport =
    close <= hourlySupport + hourlyLevelToleranceATR * safeHourATR;
def nearHourlyResistance =
    close >= hourlyResistance - hourlyLevelToleranceATR * safeHourATR;
def lowerHourlyRange =
    !nearHourlySupport and !nearHourlyResistance and
    hourlyRangePosition < 0.35;
def upperHourlyRange =
    !nearHourlySupport and !nearHourlyResistance and
    hourlyRangePosition > 0.65;
def middleHourlyRange =
    !nearHourlySupport and !nearHourlyResistance and
    !lowerHourlyRange and !upperHourlyRange;

plot HourResistance =
    if showHourlyLevels then hourlyResistance else Double.NaN;
HourResistance.SetDefaultColor(Color.RED);
HourResistance.SetStyle(Curve.SHORT_DASH);
HourResistance.SetLineWeight(2);
HourResistance.HideBubble();
HourResistance.HideTitle();

plot HourSupport =
    if showHourlyLevels then hourlySupport else Double.NaN;
HourSupport.SetDefaultColor(Color.GREEN);
HourSupport.SetStyle(Curve.SHORT_DASH);
HourSupport.SetLineWeight(2);
HourSupport.HideBubble();
HourSupport.HideTitle();

plot HourMidline =
    if showHourlyLevels then hourlyMid else Double.NaN;
HourMidline.SetDefaultColor(Color.GRAY);
HourMidline.SetStyle(Curve.POINTS);
HourMidline.SetLineWeight(1);
HourMidline.HideBubble();
HourMidline.HideTitle();

# ============================================================
# FIFTEEN-MINUTE SETUP -- TREND, TRANSITION, OR COMPRESSION
# EMA separation is normalized by the 15-minute ATR.
# ============================================================
def close15 = close(period = AggregationPeriod.FIFTEEN_MIN);
def high15 = high(period = AggregationPeriod.FIFTEEN_MIN);
def low15 = low(period = AggregationPeriod.FIFTEEN_MIN);
def fastEMA15 = ExpAverage(close15, fastLength);
def slowEMA15 = ExpAverage(close15, slowLength);
def atr15 = WildersAverage(TrueRange(high15, close15, low15), atrLength);
def separation15 =
    if atr15 > 0 then (fastEMA15 - slowEMA15) / atr15 else 0;

def fifteenCompression =
    AbsValue(separation15) <= compressionSeparationATR;
def fifteenBullTrend =
    separation15 >= meaningfulSeparationATR and
    close15 > slowEMA15;
def fifteenBearTrend =
    separation15 <= -meaningfulSeparationATR and
    close15 < slowEMA15;
def fifteenBullTransition =
    separation15 > compressionSeparationATR and
    separation15 < meaningfulSeparationATR;
def fifteenBearTransition =
    separation15 < -compressionSeparationATR and
    separation15 > -meaningfulSeparationATR;

def fifteenBullExpanding =
    separation15 > 0 and separation15 > separation15[1];
def fifteenBullContracting =
    separation15 > 0 and separation15 < separation15[1];
def fifteenBearExpanding =
    separation15 < 0 and separation15 < separation15[1];
def fifteenBearContracting =
    separation15 < 0 and separation15 > separation15[1];

# ============================================================
# FIVE-MINUTE EXECUTION -- CURRENT-CHART TRIGGER
# Trigger requires price acceptance above/below the 9 EMA and VWAP,
# plus a break of the preceding 5-minute candle.
# ============================================================
def fastEMA5 = ExpAverage(close, fastLength);
def slowEMA5 = ExpAverage(close, slowLength);
def sessionVWAP = VWAP();
def atr5 = WildersAverage(TrueRange(high, close, low), atrLength);

def fiveBullState =
    close > fastEMA5 and
    fastEMA5 > slowEMA5 and
    close > sessionVWAP;

def fiveBearState =
    close < fastEMA5 and
    fastEMA5 < slowEMA5 and
    close < sessionVWAP;

def fiveBullTrigger =
    fiveBullState and
    close > high[1] and
    close > open;

def fiveBearTrigger =
    fiveBearState and
    close < low[1] and
    close < open;

# ============================================================
# SYNTHESIS -- REGIME + LOCATION + SETUP + TRIGGER
# Higher-timeframe agreement grants permission; the 5-minute bar executes.
# ============================================================
def longPermission =
    dailyBull and
    (fifteenBullTrend or fifteenBullTransition) and
    !nearHourlyResistance;

def shortPermission =
    dailyBear and
    (fifteenBearTrend or fifteenBearTransition) and
    !nearHourlySupport;

def longExecute = longPermission and fiveBullTrigger;
def shortExecute = shortPermission and fiveBearTrigger;
def longWatch = longPermission and !fiveBullTrigger;
def shortWatch = shortPermission and !fiveBearTrigger;

def longRoomATR =
    if atr5 > 0 then (hourlyResistance - close) / atr5 else 0;
def shortRoomATR =
    if atr5 > 0 then (close - hourlySupport) / atr5 else 0;

# ============================================================
# SIGNALS
# ============================================================
plot LongArrow =
    if showSignalArrows and longExecute and !longExecute[1]
    then low - 0.20 * atr5
    else Double.NaN;
LongArrow.SetPaintingStrategy(PaintingStrategy.ARROW_UP);
LongArrow.SetDefaultColor(Color.GREEN);
LongArrow.SetLineWeight(3);

plot ShortArrow =
    if showSignalArrows and shortExecute and !shortExecute[1]
    then high + 0.20 * atr5
    else Double.NaN;
ShortArrow.SetPaintingStrategy(PaintingStrategy.ARROW_DOWN);
ShortArrow.SetDefaultColor(Color.RED);
ShortArrow.SetLineWeight(3);

# ============================================================
# DASHBOARD
# ============================================================
AddLabel(showDashboard and !correctChart,
    "WARNING: USE ON 5-MINUTE CHART",
    Color.YELLOW);

AddLabel(showDashboard,
    if dailyBull then "DAILY: BULL PERMISSION"
    else if dailyBear then "DAILY: BEAR PERMISSION"
    else "DAILY: TRANSITION / NO BIAS",
    if dailyBull then Color.GREEN
    else if dailyBear then Color.RED
    else Color.YELLOW);

AddLabel(showDashboard,
    if nearHourlySupport then
        "1H LOCATION: SUPPORT " + Round(hourlySupport, 2)
    else if nearHourlyResistance then
        "1H LOCATION: RESISTANCE " + Round(hourlyResistance, 2)
    else if lowerHourlyRange then "1H LOCATION: LOWER RANGE"
    else if upperHourlyRange then "1H LOCATION: UPPER RANGE"
    else "1H LOCATION: MID-RANGE",
    if nearHourlySupport then Color.GREEN
    else if nearHourlyResistance then Color.RED
    else if lowerHourlyRange or upperHourlyRange then Color.CYAN
    else Color.GRAY);

AddLabel(showDashboard,
    if fifteenBullTrend and fifteenBullExpanding then
        "15M SETUP: BULL EXPANDING"
    else if fifteenBullTrend and fifteenBullContracting then
        "15M SETUP: BULL FADING"
    else if fifteenBearTrend and fifteenBearExpanding then
        "15M SETUP: BEAR EXPANDING"
    else if fifteenBearTrend and fifteenBearContracting then
        "15M SETUP: BEAR FADING"
    else if fifteenBullTransition then "15M SETUP: BULL BUILDING"
    else if fifteenBearTransition then "15M SETUP: BEAR BUILDING"
    else if fifteenCompression then "15M SETUP: COMPRESSION"
    else "15M SETUP: MIXED",
    if fifteenBullTrend and fifteenBullExpanding then Color.GREEN
    else if fifteenBearTrend and fifteenBearExpanding then Color.RED
    else if fifteenBullTrend or fifteenBearTrend then Color.YELLOW
    else if fifteenBullTransition or fifteenBearTransition then Color.CYAN
    else Color.GRAY);

AddLabel(showDashboard,
    if fiveBullTrigger then "5M TRIGGER: BULL BREAK"
    else if fiveBearTrigger then "5M TRIGGER: BEAR BREAK"
    else if fiveBullState then "5M TRIGGER: BULL STATE / WAIT"
    else if fiveBearState then "5M TRIGGER: BEAR STATE / WAIT"
    else "5M TRIGGER: NOT READY",
    if fiveBullTrigger then Color.GREEN
    else if fiveBearTrigger then Color.RED
    else if fiveBullState or fiveBearState then Color.YELLOW
    else Color.GRAY);

AddLabel(showDashboard,
    if longExecute then "ACTION: CONFIRMED LONG EXECUTE"
    else if shortExecute then "ACTION: CONFIRMED SHORT EXECUTE"
    else if longWatch then "ACTION: LONG WATCH - NEED 5M TRIGGER"
    else if shortWatch then "ACTION: SHORT WATCH - NEED 5M TRIGGER"
    else if dailyTransition then "ACTION: WAIT - DAILY TRANSITION"
    else if fifteenCompression then "ACTION: WAIT - 15M COMPRESSION"
    else "ACTION: WAIT - TIMEFRAMES CONFLICT",
    if longExecute then Color.GREEN
    else if shortExecute then Color.RED
    else if longWatch or shortWatch then Color.YELLOW
    else Color.GRAY);

AddLabel(showDashboard and (longPermission or shortPermission),
    if longPermission then
        "TARGET: 1H R " + Round(hourlyResistance, 2) +
        " | ROOM " + Round(longRoomATR, 1) + " ATR"
    else
        "TARGET: 1H S " + Round(hourlySupport, 2) +
        " | ROOM " + Round(shortRoomATR, 1) + " ATR",
    Color.CYAN);

Alert(enableAlerts and longExecute and !longExecute[1],
      "CONFIRMED LONG EXECUTE", Alert.BAR, Sound.Ding);
Alert(enableAlerts and shortExecute and !shortExecute[1],
      "CONFIRMED SHORT EXECUTE", Alert.BAR, Sound.Ding);
Last edited by a moderator:
