
Cmeeker778
New member
I am in need of help with finishing this code.
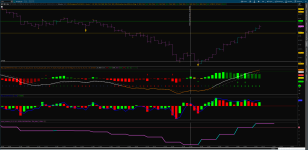
I'm trying to color lower timeframe candles, with a shift in moving average cross on a higher timeframe.
So if the 10 min 3 and 10 ema hasn't crossed, then the colors will not shift until that occurs.
I have line drawn in where the 10 min has shifted, but as you can see the candle colors are not steady or consistent on the up move (the colors change too much, should be steady change)
Any help would be appreciated!
FYI:
The SuperMomentum indicator is a proprietary indicator, cannot be shared. I did not create. Sorry
declare lower;
input Fast = 3;
input Slow = 10;
input displace = 0;
input priceclose = close;
input averageType = AverageType.EXPONENTIAL;
input period = AggregationPeriod.TEN_MIN;
plot AVG = MovingAverage(averageType, close(period = aggregationperiod.ten_min), FASt) - MovingAverage(averageType, close(period = aggregationPeriod.TEN_MIN), SLOW);
plot ZeroLine = 0;
AVG.DefineColor("Up", GetColor(1));
AVG.DefineColor("Down", GetColor(0));
AVG.AssignValueColor(if AVG > AVG[1] then AVG.Color("Up") else AVG.Color("Down"));
AssignPriceColor(if AVG > AVG[1] then AVG.Color("Up") else AVG.Color("Down"));
Attachments
Last edited by a moderator: