This simple indicator is based on the ICT 'Silver Bullet' concept. The idea is that the first gap created after the New York open becomes an important price area that price will react to in the future. This is really just a refined version of opening range price as it attempts to find the 'most sensitive' area in the opening range. See this description from ICT for more information. This is intended to be used on index futures and only on timeframes of 5 minutes or less.

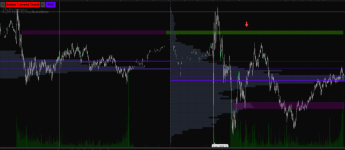
As per the link above, the idea is that you've done higher timeframe analysis and are expecting price to move to an obvious area. You can use the first gap area as an entry to move into your expected direction. The study allows you to select a time period to search for the first gap - it defaults to the first 30 minutes. You can also specify how large the gap needs to be to qualify - it defaults to 2 ticks. It will print a cloud for the gap area until 4pm. If you were a curious sort and traded different hours, you could try to identify the first gap after the Euro or Asian open and backtest their performance.
As per the link above, the idea is that you've done higher timeframe analysis and are expecting price to move to an obvious area. You can use the first gap area as an entry to move into your expected direction. The study allows you to select a time period to search for the first gap - it defaults to the first 30 minutes. You can also specify how large the gap needs to be to qualify - it defaults to 2 ticks. It will print a cloud for the gap area until 4pm. If you were a curious sort and traded different hours, you could try to identify the first gap after the Euro or Asian open and backtest their performance.
Ruby:
# Created by @tony_futures inspired by the ICT 'Silver Bullet' concept

input agg = AggregationPeriod.FIVE_MIN;
input NY_Open = 0930;
input Gap_End = 1000;
input NY_Close = 1600;
input requiredTicks = 2; # minimum gap size
def xH = high(period = agg);
def xL = low(period = agg);
def xH2 = high(period = agg)[2];
def xL2 = low(period = agg)[2];
def currentAgg = agg / 60000;

Assert(currentAgg <= 5,"This study is meant to work on timeframes of 5 minutes or less");

def Gap_Start = NY_Open + (currentAgg * 2);
def rth = SecondsFromTime(Gap_Start) >= 0 and SecondsTillTime(Gap_End) >= 0;
def paint = SecondsFromTime(Gap_Start)[1] >= 0 and SecondsTillTime(NY_Close) >= 0;

def bearishGap = xH < xL[2] and (AbsValue(xH - xL[2]) >= (requiredTicks * tickSize()));
def bullishGap = xH[2] < xL and (AbsValue(xH[2] - xL) >= (requiredTicks * tickSize()));

def firstCandle = SecondsFromTime(0930) == 0;
def firstGapHigh = if firstCandle then 0 else if firstGapHigh[1] == 0 and rth and bullishGap then xL else if firstGapHigh[1] == 0 and rth and bearishGap then xL2 else  firstGapHigh[1];
def firstGapLow = if firstCandle then 0 else if firstGapLow[1] == 0 and rth and bullishGap then xH2  else if firstGapLow[1] == 0 and rth and bearishGap then xH else firstGapLow[1];

def bGH = firstGapHigh;
def bGL = firstGapLow[1];

DefineGlobalColor("CloudColor", Color.GRAY);
AddCloud(if paint and bGH[1] != 0 then bGH else Double.NaN,bGL,GlobalColor("CloudColor"), GlobalColor("CloudColor"));