Repaints MTF Awesome Oscillator For ThinkOrSwim

Repaints

rajaodu1

Member
VIP
HI Script Gurus,

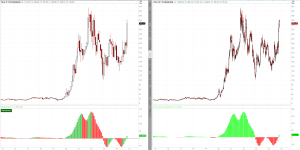
Can you please help me to create a Multi time frame (say 5, 15, 1 hour) Awesome Line oscillator in 1 min time frame candle chart? Thanks for your help in advance.


1734484550552.png


and have options to change the up and down color for each time frame, so that the awesome line oscillator can be easily identified.

@BenTen @SleepyZ any help please
 
Last edited by a moderator:
Solution
HI Script Gurus,

Can you please help me to create a Multi time frame (say 5, 15, 1 hour) Awesome Line oscillator in 1 min time frame candle chart? Thanks for your help in advance.


Code:
declare lower;
declare zerobase;

input Agg1 = AggregationPeriod.THREE_MIN;
input Agg2 = AggregationPeriod.FIVE_MIN;
input Agg3 = AggregationPeriod.FIFTEEN_MIN;
input Agg4 = AggregationPeriod.Thirty_MIN;


plot AO = Average(hl2, 5) - Average(hl2, 34);
plot Zero = 0;

#AO.SetPaintingStrategy(PaintingStrategy.HISTOGRAM);
AO.SetLineWeight(2);
AO.DefineColor("Up", Color.GREEN);
AO.DefineColor("Down", Color.RED);
AO.AssignValueColor(if AO > AO[1] then AO.color("Up") else if AO < AO[1] then AO.color("Down") else GetColor(1))...
HI Script Gurus,

Can you please help me to create a Multi time frame (say 5, 15, 1 hour) Awesome Line oscillator in 1 min time frame candle chart? Thanks for your help in advance.


Code:
declare lower;
declare zerobase;

input Agg1 = AggregationPeriod.THREE_MIN;
input Agg2 = AggregationPeriod.FIVE_MIN;
input Agg3 = AggregationPeriod.FIFTEEN_MIN;
input Agg4 = AggregationPeriod.Thirty_MIN;


plot AO = Average(hl2, 5) - Average(hl2, 34);
plot Zero = 0;

#AO.SetPaintingStrategy(PaintingStrategy.HISTOGRAM);
AO.SetLineWeight(2);
AO.DefineColor("Up", Color.GREEN);
AO.DefineColor("Down", Color.RED);
AO.AssignValueColor(if AO > AO[1] then AO.color("Up") else if AO < AO[1] then AO.color("Down") else GetColor(1));
Zero.SetDefaultColor(COLOR.YELLOW);


View attachment 23583

and have options to change the up and down color for each time frame, so that the awesome line oscillator can be easily identified.

@BenTen @SleepyZ any help please

I have the colors for each agg green/red (you can change them at the input screen or within the code)
Optional labels and/or bubbles added
declare lower;
declare zerobase;

input Agg1 = AggregationPeriod.THREE_MIN;
input Agg2 = AggregationPeriod.FIVE_MIN;
input Agg3 = AggregationPeriod.FIFTEEN_MIN;
input Agg4 = AggregationPeriod.THIRTY_MIN;


plot AO = Average(hl2, 5) - Average(hl2, 34);
def A0 = if AO > AO[1] then 1 else if AO < AO[1] then 0 else A0[1];
plot AO1 = if IsNaN(close) then Double.NaN else Average(hl2(period = Agg1), 5) - Average(hl2(period = Agg1), 34);
def A1 = if AO1 > AO1[1] then 1 else if AO1 < AO1[1] then 0 else A1[1];
plot AO2 = if IsNaN(close) then Double.NaN else Average(hl2(period = Agg2), 5) - Average(hl2(period = Agg2), 34);
def A2 = if AO2 > AO2[1] then 1 else if AO2 < AO2[1] then 0 else A2[1];
plot AO3 = if IsNaN(close) then Double.NaN else Average(hl2(period = Agg3), 5) - Average(hl2(period = Agg3), 34);
def A3 = if AO3 > AO3[1] then 1 else if AO3 < AO3[1] then 0 else A3[1];
plot AO4 = if IsNaN(close) then Double.NaN else Average(hl2(period = Agg4), 5) - Average(hl2(period = Agg4), 34);
def A4 = if AO4 > AO4[1] then 1 else if AO4 < AO4[1] then 0 else A4[1];
plot Zero = 0;

#AO.SetPaintingStrategy(PaintingStrategy.HISTOGRAM);
AO.SetLineWeight(2);
AO.DefineColor("Up", Color.GREEN);
AO.DefineColor("Down", Color.RED);
AO.AssignValueColor(if A0 == 1 then AO.Color("Up") else AO.Color("Down"));
AO1.SetLineWeight(2);
AO1.DefineColor("Up1", Color.GREEN);
AO1.DefineColor("Down1", Color.RED);
AO1.AssignValueColor(if A1 == 1 then AO1.Color("Up1") else AO1.Color("Down1"));
AO2.SetLineWeight(2);
AO2.DefineColor("Up2", Color.GREEN);
AO2.DefineColor("Down2", Color.RED);
AO2.AssignValueColor(if A2 == 1 then AO2.Color("Up2") else AO2.Color("Down2"));
AO3.SetLineWeight(2);
AO3.DefineColor("Up3", Color.GREEN);
AO3.DefineColor("Down3", Color.RED);
AO3.AssignValueColor(if A3 == 1 then AO3.Color("Up3") else AO3.Color("Down3"));
AO4.SetLineWeight(2);
AO4.DefineColor("Up4", Color.GREEN);
AO4.DefineColor("Down4", Color.RED);
AO4.AssignValueColor(if A4 == 1 then AO4.Color("Up4") else AO4.Color("Down4"));
Zero.SetDefaultColor(Color.LIGHT_GRAY);

input bubbles = yes;
def bubblemover = 1;
def mover = bubbles and IsNaN(close[bubblemover]) and !IsNaN(close[bubblemover + 1]);
AddChartBubble(mover, AO[bubblemover + 1], GetAggregationPeriod() / 60000 , if A0[bubblemover + 1] == 1 then AO.Color("Up") else AO.Color("Down"), no);
AddChartBubble(bubbles and IsNaN(close[bubblemover + 1]) and !IsNaN(close[bubblemover + 1 + 1]), AO1[bubblemover + 1 + 1], Agg1 / 60000 , if A1[bubblemover + 1 + 1] == 1 then AO1.Color("Up1") else AO1.Color("Down1"));
AddChartBubble(bubbles and IsNaN(close[bubblemover + 2]) and !IsNaN(close[bubblemover + 1 + 2]), AO2[bubblemover + 1 + 2], Agg2 / 60000 , if A2[bubblemover + 1 + 2] == 1 then AO2.Color("Up2") else AO2.Color("Down2"));
AddChartBubble(bubbles and IsNaN(close[bubblemover + 3]) and !IsNaN(close[bubblemover + 1 + 3]), AO3[bubblemover + 1 + 3], Agg3 / 60000 , if A3[bubblemover + 1 + 3] == 1 then AO3.Color("Up3") else AO3.Color("Down3"));
AddChartBubble(bubbles and IsNaN(close[bubblemover + 4]) and !IsNaN(close[bubblemover + 1 + 4]), AO4[bubblemover + 1 + 4], Agg4 / 60000 , if A4[bubblemover + 1 + 4] == 1 then AO4.Color("Up4") else AO4.Color("Down4"));

input labels = yes;
AddLabel(labels, GetAggregationPeriod() / 60000 + "m", if A0 == 1 then AO.Color("Up") else AO.Color("Down"));
AddLabel(labels, Agg1 / 60000 + "m", if A1 == 1 then AO1.Color("Up1") else AO1.Color("Down1"));
AddLabel(labels, Agg2 / 60000 + "m", if A2 == 1 then AO2.Color("Up2") else AO2.Color("Down2"));
AddLabel(labels, Agg3 / 60000 + "m", if A3 == 1 then AO3.Color("Up3") else AO3.Color("Down3"));
AddLabel(labels, Agg4 / 60000 + "m", if A4 == 1 then AO4.Color("Up4") else AO4.Color("Down4"));

#
 
Last edited:
Solution

Join useThinkScript to post your question to a community of 21,000+ developers and traders.

@SleepyZ

At 5 min or above instead of smooth AO curve, it shows like lines. Will it be possible to get smooth lines just like it is shown in 1 min? This will help to see the divergence in 5 min AO line also (just like in 1 min AO line)

1734655632119.png
 
@SleepyZ

At 5 min or above instead of smooth AO curve, it shows like lines. Will it be possible to get smooth lines just like it is shown in 1 min? This will help to see the divergence in 5 min AO line also (just like in 1 min AO line)

View attachment 23597

@rajaodu1 While @SleepyZ would be able to incorporate smoothing of the results of higher timeframes, by incorporating an averaged result, doing so would not reflect the actual results, skewing the representative values... Stair-stepping is a very common occurrence with MTF indicators... This is something we, as traders, generally take into consideration... The more we try to smooth results, the further from actual values we get... It's a balancing act... Just sharing logic here but we'll see if @SleepyZ chimes in on your request...
 
@rad14733 thanks for your reply. I see your point. I am in learning stage on trading, so I need to learn the stair stepping method.

If you see the chart below, they are 5 min and 1 min. I added AO and the AO line. I was visualizing to see the AO line from 5 min on 1 min. Same format.

If this is not easy and more complicated, then I will learn to use stair stepping.


1734658201450.png
 
Explanation of the Repainting Stairs of MTF Indicators.

If you're viewing the 5-minute and 15-minute values on a 1-minute chart, each 15-minute bar represents 15 consecutive 1-minute bars. The value of the HTF indicator remains flat or "plateaued" during those 15 minutes because it is a reflection of the single value of the higher timeframe bar.

NOTE: until the 15-minute bar closes, its value is recalculated with every tick of incoming price data. This recalculation causes the indicator to "repaint" its plotted values for all 15 bars within that 15-minute window.

Key Points:
  1. Flat Plots: of course, the HTF values appear stepped on LTF charts. If the value of the 15-min bar is -13 then that same -13 has to plot on 15 of one-minute bars to represent the 15-min bar value.
  2. Repainting: Those 15 one-minute bars will repaint on every tick. Until the 15-min bar closes; at which time, there will be one final repaint.
Why This Matters for Trading:
Repainting indicators can give misleading signals if you base decisions on values that are still forming.
 
Last edited by a moderator:
Explanation of the Repainting Stairs of MTF Indicators.

If you're viewing the 5-minute and 15-minute values on a 1-minute chart, each 15-minute bar represents 15 consecutive 1-minute bars. The value of the HTF indicator remains flat or "plateaued" during those 15 minutes because it is a reflection of the single value of the higher timeframe bar.

NOTE: until the 15-minute bar closes, its value is recalculated with every tick of incoming price data. This recalculation causes the indicator to "repaint" its plotted values for all 15 bars within that 15-minute window.

Key Points:
  1. Flat Plots: of course, the HTF values appear stepped on LTF charts. If the value of the 15-min bar is -13 then that same -13 has to plot on 15 of one-minute bars to represent the 15-min bar value.
  2. Repainting: Those 15 one-minute bars will repaint on every tick. Until the 15-min bar closes; at which time, there will be one final repaint.
Why This Matters for Trading:
Repainting indicators can give misleading signals if you base decisions on values that are still forming.
Wow. Thanks for the explanation. I can understand now, why stair step is coming. Thanks again.

Thanks @SleepyZ and @rad14733
 
Wow. Thanks for the explanation. I can understand now, why stair step is coming. Thanks again.

Thanks @SleepyZ and @rad14733

You're welcome and thanks to everyone for their replies.

The lines could be smoothed with extra code as in this link. However, it is merely visual, not necessarily accurate, as others explained. https://usethinkscript.com/threads/...rage-indicator-for-thinkorswim.135/post-66656

Also, there was a correction to the label code coloring made in the post above. See https://usethinkscript.com/threads/mtf-awesome-oscillator-for-thinkorswim.20169/post-148854
 
Last edited:
Thread starter Similar threads Forum Replies Date
T MTF Awesome Questions 0
T MTF Last Month's High, Low, Close Questions 0
I MTF Average Daily Close Line Questions 2
D MTF Stoch Signals Questions 0
B MTF Previous Week Open / Close Questions 1

Similar threads

Not the exact question you're looking for?

Start a new thread and receive assistance from our community.

87k+ Posts
250 Online
Create Post

Similar threads

Similar threads

The Market Trading Game Changer

Join 2,500+ subscribers inside the useThinkScript VIP Membership Club
  • Exclusive indicators
  • Proven strategies & setups
  • Private Discord community
  • ‘Buy The Dip’ signal alerts
  • Exclusive members-only content
  • Add-ons and resources
  • 1 full year of unlimited support

Frequently Asked Questions

What is useThinkScript?

useThinkScript is the #1 community of stock market investors using indicators and other tools to power their trading strategies. Traders of all skill levels use our forums to learn about scripting and indicators, help each other, and discover new ways to gain an edge in the markets.

How do I get started?

We get it. Our forum can be intimidating, if not overwhelming. With thousands of topics, tens of thousands of posts, our community has created an incredibly deep knowledge base for stock traders. No one can ever exhaust every resource provided on our site.

If you are new, or just looking for guidance, here are some helpful links to get you started.

What are the benefits of VIP Membership?
VIP members get exclusive access to these proven and tested premium indicators: Buy the Dip, Advanced Market Moves 2.0, Take Profit, and Volatility Trading Range. In addition, VIP members get access to over 50 VIP-only custom indicators, add-ons, and strategies, private VIP-only forums, private Discord channel to discuss trades and strategies in real-time, customer support, trade alerts, and much more. Learn all about VIP membership here.
How can I access the premium indicators?
To access the premium indicators, which are plug and play ready, sign up for VIP membership here.
Back
Top