Thanks to this member and I modified to my need.
https://usethinkscript.com/threads/mtf-awesome-oscillator-for-thinkorswim.20169/post-148854
declare lower;
declare zerobase;
input Agg1 = AggregationPeriod.month;
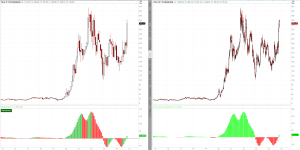
plot AO = Average(hl2, 5) - Average(hl2, 34);
def A0 = if AO > AO[1] then 1 else if AO < AO[1] then 0 else A0[1];
ao.hide();
plot AO1 = if IsNaN(close) then Double.NaN else Average(hl2(period = Agg1), 5) - Average(hl2(period = Agg1), 34);
def A1 = if AO1 > AO1[1] then 1 else if AO1 < AO1[1] then 0 else A1[1];
plot Zero = 0;
#AO.SetPaintingStrategy(PaintingStrategy.HISTOGRAM);
AO.SetLineWeight(2);
AO.DefineColor("Up", Color.GREEN);
AO.DefineColor("Down", Color.RED);
AO.AssignValueColor(if A0 == 1 then AO.Color("Up") else AO.Color("Down"));
AO1.SetLineWeight(2);
AO1.DefineColor("Up1", Color.cyan);
AO1.DefineColor("Down1", Color.magenta);
AO1.AssignValueColor(if A1 == 1 then AO1.Color("Up1") else AO1.Color("Down1"));
Zero.SetDefaultColor(Color.LIGHT_GRAY);
input bubbles = yes;
def bubblemover = 1;
def mover = bubbles and IsNaN(close[bubblemover]) and !IsNaN(close[bubblemover + 1]);
AddChartBubble(mover, AO[bubblemover + 1], GetAggregationPeriod() / 60000 , if A0[bubblemover + 1] == 1 then AO.Color("Up") else AO.Color("Down"), no);
AddChartBubble(bubbles and IsNaN(close[bubblemover + 1]) and !IsNaN(close[bubblemover + 1 + 1]), AO1[bubblemover + 1 + 1], Agg1 / 60000 , if A1[bubblemover + 1 + 1] == 1 then AO1.Color("Up1") else AO1.Color("Down1"));
input labels = yes;
AddLabel(labels, GetAggregationPeriod() / 60000 + "m", if A0 == 1 then AO.Color("Up") else AO.Color("Down"));
AddLabel(labels, Agg1 / 60000 + "m", if A1 == 1 then AO1.Color("Up1") else AO1.Color("Down1"));
#


 Anything larger (like 3m, 5m, etc.) won’t work, because TOS can’t “go backward” and assemble smaller bars from bigger ones.
 In short: