Moving Average Plots, Charts, Scans For ThinkOrSwim

MBF

Active member
2019 Donor
Hi anyone and everyone,

I am getting a little confused and overwhelmed here and this has been an ongoing problem for me. I am trying to figure out which MAs are more eyeballed as entries and exits. Lately, I have been using the hourly 50 and 200 for day trading targets. I shouldn't say using, but more like experimenting. I'm having a hard time with this. I use premarket as signals with other stuff but honestly, I am trying very hard to be as simple as possible and learn without all the bells and whistles and then integrate them later on. I guess what I am trying to say is, what do you guys use when charting out lower time frames? There are so many choices, how do you know which ones are the most reliable? Is it different for each symbol? Do you look at all the MAs on the hourly and just use the ones that specific symbol seems to follow or is there a rigid set of MAs? I don't know, I think I'm overwhelmed. Any help would be greatly appreciated. I don't know if this is the right place to ask this as this might be just TOS script stuff but thought I'd give it a go.o_O:unsure::eek:
 
Just talking about moving averages alone, here are the ones I'm using:
  1. EMA: 20, 50, and 300 (this is solely for the lower timeframe. You can replace the 300 ema with 200 ema depending on what you like better).
  2. As far as daily and weekly goes, I'm using 20 EMA, 50, and 200 SMA.
Everything comes with experiment and trading it live. If you're not comfortable with using real money, then I would use a paper trading account and take action then and there. That way, you can get a feel of how things go. Backtesting in after-hours can only do so much. You have to experience it for yourself.
 

Join useThinkScript to post your question to a community of 21,000+ developers and traders.

Honestly nobody can tell you, it's basically all experimentation. throw something on there(chart) and do some backtesting to see if there's consistency. I wouldn't, personally, put much emphasis on moving averages besides gauging trend perhaps and even then they can be utterly worthless if you're in a chopping market. As for the most widely used yeah I do believe 50 and 200 as well as 20 are most common. As for different markets, yes I think different ones work on certain markets more than others, it's all pretty relative and just fooling around sticking stuff here and there and seeing which seems to illicit positive results pretty consistently seems to be my way of getting anywhere.
 
All indicators are reliable. They show what th math tells them to show. But the market does not care what the indicators are saying. The market does follow patterns. Show what you are doing and maybe some suggestions can be made. First suggestion is Look into support / resistance.
 
Just talking about moving averages alone, here are the ones I'm using:
  1. EMA: 20, 50, and 300 (this is solely for the lower timeframe. You can replace the 300 ema with 200 ema depending on what you like better).
  2. As far as daily and weekly goes, I'm using 20 EMA, 50, and 200 SMA.
Everything comes with experiment and trading it live. If you're not comfortable with using real money, then I would use a paper trading account and take action then and there. That way, you can get a feel of how things go. Backtesting in after-hours can only do so much. You have to experience it for yourself.
Thanks @BenTen. I'll take a look at that 300, thats a new one to me. Much appreciated. 🧠
 
Honestly nobody can tell you, it's basically all experimentation. throw something on there(chart) and do some backtesting to see if there's consistency. I wouldn't, personally, put much emphasis on moving averages besides gauging trend perhaps and even then they can be utterly worthless if you're in a chopping market. As for the most widely used yeah I do believe 50 and 200 as well as 20 are most common. As for different markets, yes I think different ones work on certain markets more than others, it's all pretty relative and just fooling around sticking stuff here and there and seeing which seems to illicit positive results pretty consistently seems to be my way of getting anywhere.
Okay, so I am going down the right path then. Guess its all part of the learning curve. Thank you.(y)
 
also, if you want to be one of those weirdos(like myself) you might start putting Fibonacci numbers everywhere and seeing how those results work out.
15 minute fibs are decent. Somehow sometimes I see it showing a lot of f#$@-ery. Probably just my trust issues. 😏😋
 
All indicators are reliable. They show what th math tells them to show. But the market does not care what the indicators are saying. The market does follow patterns. Show what you are doing and maybe some suggestions can be made. First suggestion is Look into support / resistance.
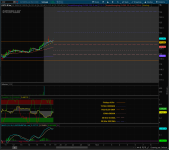
Okay let me show ... hold on.
 
Hi anyone and everyone,

I am getting a little confused and overwhelmed here and this has been an ongoing problem for me. I am trying to figure out which MAs are more eyeballed as entries and exits. Lately, I have been using the hourly 50 and 200 for day trading targets. I shouldn't say using, but more like experimenting. I'm having a hard time with this. I use premarket as signals with other stuff but honestly, I am trying very hard to be as simple as possible and learn without all the bells and whistles and then integrate them later on. I guess what I am trying to say is, what do you guys use when charting out lower time frames? There are so many choices, how do you know which ones are the most reliable? Is it different for each symbol? Do you look at all the MAs on the hourly and just use the ones that specific symbol seems to follow or is there a rigid set of MAs? I don't know, I think I'm overwhelmed. Any help would be greatly appreciated. I don't know if this is the right place to ask this as this might be just TOS script stuff but thought I'd give it a go.o_O:unsure::eek:

Well I evolved (or devolved?) to ignore moving averages as entry/exits. I only use them to trail the trend I already entered (based on other factors). And Ideally i take profits and get out even before MAs turn (they are lagging) - based on other things. And other price based indicators (MACD/RSI) etc i only use as confirmation for finer entry - not use them as basis for setups.
Imho price action by itself is a lie - it doesnt reflect true value or true direction of money flow most of the time. More like a broken clock - it is occasionally right but most often its not
Market structure is non-linear and fractal nature - no moving average can describe them. As all of price+ma based indicators (yeah even fancy ones like Ehlers) fundamentally model price action as some sort of cyclical process with well defined function - which its not.

To give a good place to start your thinking I would point to this :
https://readtheticker.smugmug.com/B...tPhasesCyclesv2.png?lastmodified=201909300000
(ignore the gann angles - just focus on what you see as a structure).

Another thing I want to point is: its is of extreme importance to understand Timeframes you are trading on (and its paramount to use at least three: 1)large TF 2) setup TF 3) entry/exit timeframe ). How its structured and the confluence of factors at pivot points on it. Intraday and intraweek trading imho required understanding of gaps, intraday market timing, intraweek inflections, options expirations and more
 
Last edited:
Okay let me show ... hold on.

MZJBDkY.png
 

Attachments

  • MZJBDkY.png
    MZJBDkY.png
    463 KB · Views: 211
Well I evolved (or devolved?) to ignore moving averages as entry/exits. I only use them to trail the trend I already entered (based on other factors). And Ideally i take profits and get out even before MAs turn (they are lagging) - based on other things.
Imho price action by itself is a lie - it doesnt reflect true value or true direction of money flow most of the time. More like a broken clock - it is occasionally right but most often its not
Market structure is non-linear and fractal nature - no moving average can describe them. As all of price+ma based indicators (yeah even fancy ones like Ehlers) fundamentally model price action as some sort of cyclical process with well defined function - which its not.

To give a good place to start your thinking I would point to this :
https://readtheticker.smugmug.com/B...tPhasesCyclesv2.png?lastmodified=201909300000
(ignore the gann angles - just focus on what you see as a structure).
Oof! That hurt! I have a penchant for Brooks, Grimes and Biggs. I have been really interested in reading the tape but ... isnt that a form of price action? Let me read what you sent. Im getting ahead of myself. Thank you.
 
@MBF All of the suggestions above are good. I've used fibs. Sometimes they've been dead on. Alluding to the above statement, all indicators are reliable, but the just indicate. It's up to you to interpret. That's the tuition you'll pay to the U of Wall Street.
 
  • Like
Reactions: MBF
Well I evolved (or devolved?) to ignore moving averages as entry/exits. I only use them to trail the trend I already entered (based on other factors). And Ideally i take profits and get out even before MAs turn (they are lagging) - based on other things. And other price based indicators (MACD/RSI) etc i only use as confirmation for finer entry - not use them as basis for setups.
Imho price action by itself is a lie - it doesnt reflect true value or true direction of money flow most of the time. More like a broken clock - it is occasionally right but most often its not
Market structure is non-linear and fractal nature - no moving average can describe them. As all of price+ma based indicators (yeah even fancy ones like Ehlers) fundamentally model price action as some sort of cyclical process with well defined function - which its not.

To give a good place to start your thinking I would point to this :
https://readtheticker.smugmug.com/B...tPhasesCyclesv2.png?lastmodified=201909300000
(ignore the gann angles - just focus on what you see as a structure).

Another thing I want to point is: its is of extreme importance to understand Timeframes you are trading on (and its paramount to use at least three: 1)large TF 2) setup TF 3) entry/exit timeframe ). How its structured and the confluence of factors at pivot points on it. Intraday and intraweek trading imho required understanding of gaps, intraday market timing, intraweek inflections, options expirations and more
I enter on a 2 min, with the 5 and 15 up. I have hourlys up on another screen. I mark out gaps. I use support and resist as pivots?
Im going to read the post you sent.
 
Oof! That hurt! I have a penchant for Brooks, Grimes and Biggs. I have been really interested in reading the tape but ... isnt that a form of price action? Let me read what you sent. Im getting ahead of myself. Thank you.

I didnt say anything about tape reading. I am talking more about understanding market structure and flow on a chose timeframe. And on timeframe I am focusing doing tape reading is irrelevant (at least for me - just clouds my judgement).
 
  • Like
Reactions: MBF
I didnt say anything about tape reading. I am talking more about understanding market structure and flow on a chose timeframe. And on timeframe I am focusing doing tape reading is irrelevant (at least for me - just clouds my judgement).
Right, I read your link as "read the tape" not "read the ticker".
 
@MBF All of the suggestions above are good. I've used fibs. Sometimes they've been dead on. Alluding to the above statement, all indicators are reliable, but the just indicate. It's up to you to interpret. That's the tuition you'll pay to the U of Wall Street.
My brain hurts.
 
I lean on price action but on my indicators as well.
Try changing your TheoRSI all the way down to 8, but not lower. Just watch from there.

Definitely forget about the Gann Angles. The rest of that is right on.
 
Last edited:
  • Wow
Reactions: MBF
hmmm, I wonder if i could save some grief by simply marking out the ATR and then using the timeframes MAs that fit into that ATR? 🧐
 
And just to add more meat. ever seen this:

MXirkS8.jpg


Now think how moving average behave and often they are lying about true nature of a move. And how often your fib/support/resistance would fail in this. They would be right - sometimes! But think about all the other times where its "a breakout" - ups not. Or that is a new trend! - gotcha!
 
  • Love
Reactions: MBF

Similar threads

Not the exact question you're looking for?

Start a new thread and receive assistance from our community.

87k+ Posts
295 Online
Create Post

Similar threads

Similar threads

The Market Trading Game Changer

Join 2,500+ subscribers inside the useThinkScript VIP Membership Club
  • Exclusive indicators
  • Proven strategies & setups
  • Private Discord community
  • ‘Buy The Dip’ signal alerts
  • Exclusive members-only content
  • Add-ons and resources
  • 1 full year of unlimited support

Frequently Asked Questions

What is useThinkScript?

useThinkScript is the #1 community of stock market investors using indicators and other tools to power their trading strategies. Traders of all skill levels use our forums to learn about scripting and indicators, help each other, and discover new ways to gain an edge in the markets.

How do I get started?

We get it. Our forum can be intimidating, if not overwhelming. With thousands of topics, tens of thousands of posts, our community has created an incredibly deep knowledge base for stock traders. No one can ever exhaust every resource provided on our site.

If you are new, or just looking for guidance, here are some helpful links to get you started.

What are the benefits of VIP Membership?
VIP members get exclusive access to these proven and tested premium indicators: Buy the Dip, Advanced Market Moves 2.0, Take Profit, and Volatility Trading Range. In addition, VIP members get access to over 50 VIP-only custom indicators, add-ons, and strategies, private VIP-only forums, private Discord channel to discuss trades and strategies in real-time, customer support, trade alerts, and much more. Learn all about VIP membership here.
How can I access the premium indicators?
To access the premium indicators, which are plug and play ready, sign up for VIP membership here.
Back
Top