Moving Average Golden Cross - Death Cross For ThinkOrSwim

starone777

New member
I have a idea that i been working of or awhile. Everyone knows about golden crosses and death crosses (crossing of 50 SMA and the 200 SMA). I would like to have a code that plots the 2 SMA's lines on the chart. Also painting the bars red for down for death cross, paint bar green for golden cross. I would also like to have an arrow with the words paint on the chart (death cross or golden cross). I would also like to have label boxes that will color green after a golden cross and red after death cross. I would like the boxes to change colors based upon the last cross.
 
Hi, is this what you had in mind? I added options to hide the labels or arrows if you want.

tvReIkY.png


Here is the link and code: http://tos.mx/oiHtRoD

Code:
## Golden and Death Cross indicator
## Coded by Chemmy at usethinkscript.com

input src = close;
input fast = 50;
input slow = 200;
input avgtype = AverageType.SIMPLE;
input color_bars = yes;
input show_bubbles = yes;
input show_arrows = yes;

def bn = barnumber();

script barssince {
    input Condition = 0;
    def barssince = if Condition then 1 else barssince[1] + 1;
    plot return = barssince;
}

plot fastma = MovingAverage(avgtype, src, fast);
plot slowma = MovingAverage(avgtype, src, slow);

fastma.setdefaultcolor(color.light_green);
slowma.setdefaultcolor(color.red);

assignpricecolor(if color_bars then (if fastma>=slowma then color.green else color.red) else color.current);

def crossup = fastma crosses above slowma ;
def crossdn = fastma crosses below slowma;

def uplabel = if show_bubbles and crossup then slowma else double.nan;
def dnlabel = if show_bubbles and crossdn then slowma else double.nan;

AddChartBubble(crossup, uplabel, "Golden", Color.GREEN, no);
AddChartBubble(crossdn, dnlabel, "Death", Color.RED, no);

plot up = show_arrows and crossup;
plot dn = show_arrows and crossdn;
up.setpaintingstrategy(paintingstrategy.boolean_arrow_up);
dn.setpaintingstrategy(paintingstrategy.boolean_arrow_down);
up.setdefaultcolor(color.light_green);
dn.setdefaultcolor(color.light_red);

addlabel(yes, if fastma>=slowma then "Golden Cross " + barssince(crossup) + " bars ago" else if fastma<slowma then "Death Cross " + barssince(crossdn) + " bars ago" else "",
 if fastma>=slowma then color.green else if fastma<slowma then color.red else color.gray);


# END CODE
 
This script is an alert for the daily chart. It will show you when a golden cross or death cross has been activated. It has two alerts and an adjustable feature on each.


# Death Cross and Golden Cross Text Alert
# Daily Chart

input ema50Length = 50;
input ema200Length = 200;

def ema50 = ExpAverage(close, ema50Length);
def ema200 = ExpAverage(close, ema200Length);

def isDeathCross = if ema50 < ema200 and ema50[1] >= ema200[1] then 1 else 0;
def isGoldenCross = if ema50 > ema200 and ema50[1] <= ema200[1] then 1 else 0;

AddLabel(isDeathCross == 1, "Death Cross", Color.RED);
AddLabel(isGoldenCross == 1, "Golden Cross", Color.GREEN);

Alert(isDeathCross == 1, "Death Cross", Alert.BAR, Sound.Ding);
Alert(isGoldenCross == 1, "Golden Cross", Alert.BAR, Sound.Ding);
 
I created a bunch of labels for your indicator.

the script works but the way TOS renders data not all aggregation periods work on the 1 minute charts.

Edit: A work around I found to work is to great smaller grids for the 1hr & 1day labels.


This layout of mine is why I created this label study.

https://tos.mx/frSdEPD


Code:
## Golden and Death Cross indicator
## Coded by Chemmy at usethinkscript.com

#input src = close;
input fast = 50;
input slow = 200;
input avgtype = AverageType.SIMPLE;
input color_bars = yes;
input show_bubbles = yes;
input show_arrows = yes;

input one_minute_label = yes;
input two_minute_label = yes;
input five_minute_label = yes;
input ten_minute_label = yes;
input fifteen_minute_label = yes;
input thirty_minute_label = yes;

input one_hour_label = yes;
input two_hour_label = yes;
input four_hour_label = yes;

input one_day_label = yes;
input five_day_label = yes;
input one_month_label = yes;
input one_year_label = yes;

def Ag_1_min = AggregationPeriod.MIN;
def Ag_1_min_close = close(period = Ag_1_min);

def Ag_2_min = AggregationPeriod.two_MIN;
def Ag_2_min_close = close(period = Ag_2_min);

def Ag_5_min = AggregationPeriod.FIVE_MIN;
def Ag_5_min_close = close(period = Ag_5_min);

def Ag_10_min = AggregationPeriod.ten_MIN;
def Ag_10_min_close = close(period = Ag_10_min);

def Ag_15_min = AggregationPeriod.FIFTEEN_MIN;
def Ag_15_min_close = close(period = Ag_15_min);

def Ag_30_min = AggregationPeriod.THIRTY_MIN;
def Ag_30_min_close = close(period = Ag_30_min);

def Ag_1hr = AggregationPeriod.HOUR;
def Ag_1hr_close = close(period = Ag_1hr);

def Ag_2_hr = AggregationPeriod.TWO_HOURS;
def Ag_2_hr_close = close(period = Ag_2_hr);

def Ag_4_hr = AggregationPeriod.four_HOURS;
def Ag_4_hr_close = close(period = Ag_4_hr);

def Ag_day = AggregationPeriod.day;
def Ag_day_close = close(period = Ag_day);

def Ag_week = AggregationPeriod.week;
def Ag_week_close = close(period = ag_week);

def Ag_month = AggregationPeriod.month;
def Ag_month_close = close(period = Ag_month);

def Ag_year = AggregationPeriod.year;
def Ag_year_close = close(period = Ag_year);

def bn = barnumber();

script barssince {
    input Condition = 0;
    def barssince = if Condition then 1 else barssince[1] + 1;
    plot return = barssince;
}


###################################################################################################
###################################################################################################

plot fast_Plot_1_minute = MovingAverage(avgtype, Ag_1_min_close, fast);
fast_Plot_1_minute.Hide();

plot slow_Plot_1_minute = MovingAverage(avgtype, Ag_1_min_close, slow);
slow_Plot_1_minute.Hide();

plot fast_Plot_2_minute = MovingAverage(avgtype, Ag_2_min_close, fast);
fast_Plot_2_minute.Hide();
 
plot slow_Plot_2_minute = MovingAverage(avgtype, Ag_2_min_close, slow);
slow_Plot_2_minute.Hide();

plot fast_Plot_5_minute = MovingAverage(avgtype, Ag_5_min_close, fast);
fast_Plot_5_minute.Hide();

plot slow_Plot_5_minute = MovingAverage(avgtype, Ag_5_min_close, slow);
slow_Plot_5_minute.Hide();

plot fast_Plot_10_minute = MovingAverage(avgtype, Ag_10_min_close, fast);
fast_Plot_10_minute.Hide();

plot slow_Plot_10_minute = MovingAverage(avgtype, Ag_10_min_close, slow);
slow_Plot_10_minute.Hide();

plot fast_Plot_15_minute = MovingAverage(avgtype, Ag_15_min_close, fast);
fast_Plot_15_minute.Hide();
 
plot slow_Plot_15_minute = MovingAverage(avgtype, Ag_15_min_close, slow);
slow_Plot_15_minute.Hide();

plot fast_Plot_30_minute = MovingAverage(avgtype, Ag_30_min_close, fast);
fast_Plot_30_minute.Hide();
 
plot slow_Plot_30_minute = MovingAverage(avgtype, Ag_30_min_close, slow);
slow_Plot_30_minute.Hide();


plot fast_Plot_1_hr = MovingAverage(avgtype, Ag_1hr_close, fast);
fast_Plot_1_hr.Hide();

plot slow_Plot_1_hr = MovingAverage(avgtype, Ag_1hr_close, slow);
slow_Plot_1_hr.Hide();

plot fast_Plot_2_hr = MovingAverage(avgtype, Ag_2_hr_close, fast);
fast_Plot_2_hr.Hide();
 
plot slow_Plot_2_hr = MovingAverage(avgtype, Ag_2_hr_close, slow);
slow_Plot_2_hr.Hide();

plot fast_Plot_4_hr = MovingAverage(avgtype, Ag_4_hr_close, fast);
fast_Plot_4_hr.Hide();

plot slow_Plot_4_hr = MovingAverage(avgtype, Ag_4_hr_close, slow);
slow_Plot_4_hr.Hide();


plot fast_Plot_day = MovingAverage(avgtype, Ag_day, fast);
fast_Plot_day.Hide();
 
plot slow_Plot_day = MovingAverage(avgtype, Ag_day, slow);
slow_Plot_day.Hide();

plot fast_Plot_week = MovingAverage(avgtype, ag_week, fast);
fast_Plot_week .Hide();
 
plot slow_Plot_week = MovingAverage(avgtype, ag_week, slow);
slow_Plot_week.Hide();

plot fast_Plot_month = MovingAverage(avgtype, Ag_month, fast);
fast_Plot_month.Hide();
 
plot slow_Plot_month = MovingAverage(avgtype, Ag_month, slow);
slow_Plot_month.Hide();

plot fast_Plot_year = MovingAverage(avgtype, Ag_year, fast);
fast_Plot_year.Hide();
 
plot slow_Plot_year = MovingAverage(avgtype, Ag_year, slow);
slow_Plot_year.Hide();


#fast_Plot_1_minute.setdefaultcolor(color.light_green);
#slow_Plot_1_minute.setdefaultcolor(color.red);

assignpricecolor(if color_bars then (if fast_Plot_1_minute>=slow_Plot_1_minute then color.green else color.red) else color.current);

def crossup_1m = fast_Plot_1_minute crosses above slow_Plot_1_minute;
def crossdn_1m = fast_Plot_1_minute crosses below slow_Plot_1_minute;

def crossup_2m = fast_Plot_2_minute crosses above slow_Plot_2_minute;
def crossdn_2m = fast_Plot_2_minute crosses below slow_Plot_2_minute;

def crossup_5m = fast_Plot_5_minute crosses above slow_Plot_5_minute;
def crossdn_5m = fast_Plot_5_minute crosses below slow_Plot_5_minute;

def crossup_10m = fast_Plot_10_minute crosses above slow_Plot_10_minute;
def crossdn_10m = fast_Plot_10_minute crosses below slow_Plot_10_minute;

def crossup_15m = fast_Plot_15_minute crosses above slow_Plot_15_minute;
def crossdn_15m = fast_Plot_15_minute crosses below slow_Plot_15_minute;

def crossup_30m = fast_Plot_30_minute crosses above slow_Plot_30_minute;
def crossdn_30m = fast_Plot_30_minute crosses below slow_Plot_30_minute;


def crossup_1hr = fast_Plot_1_hr crosses above slow_Plot_1_hr;
def crossdn_1hr = fast_Plot_1_hr crosses below slow_Plot_1_hr;

def crossup_2hr = fast_Plot_2_hr crosses above slow_Plot_2_hr;
def crossdn_2hr = fast_Plot_2_hr crosses below slow_Plot_2_hr;

def crossup_4hr = fast_Plot_4_hr crosses above slow_Plot_4_hr;
def crossdn_4hr = fast_Plot_4_hr crosses below slow_Plot_4_hr;


def crossup_1day = fast_Plot_day crosses above slow_Plot_day;
def crossdn_1day = fast_Plot_day crosses below slow_Plot_day;

def crossup_1week = fast_Plot_week crosses above slow_Plot_week;
def crossdn_1week = fast_Plot_week crosses below slow_Plot_week;

def crossup_1month = fast_Plot_month crosses above slow_Plot_month;
def crossdn_1month = fast_Plot_month crosses below slow_Plot_month;

def crossup_1year = fast_Plot_year crosses above slow_Plot_year;
def crossdn_1year = fast_Plot_year crosses below slow_Plot_1_minute;


#def uplabel= if show_bubbles and crossup then slow_Plot_1_minute else double.nan;
#def dnlabel = if show_bubbles and crossdn then slow_Plot_1_minute else double.nan;


#plot up = show_arrows and crossup;
#plot dn = show_arrows and crossdn;
#up.Hide();
#dn.Hide();
#up.setpaintingstrategy(paintingstrategy.boolean_arrow_up);
#dn.setpaintingstrategy(paintingstrategy.boolean_arrow_down);
#up.setdefaultcolor(color.light_green);
#dn.setdefaultcolor(color.white);

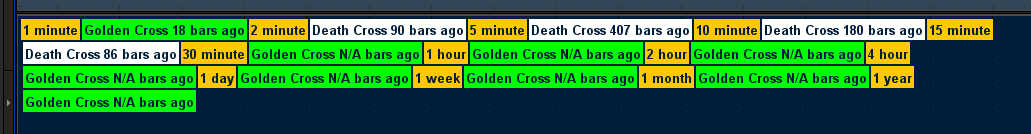
AddLabel(one_minute_label, "1 minute", Color.orange);
addlabel(one_minute_label, if fast_Plot_1_minute>=slow_Plot_1_minute then "Golden Cross " + barssince(crossup_1m) + " bars ago" else if fast_Plot_1_minute<slow_Plot_1_minute then "Death Cross " + barssince(crossdn_1m) + " bars ago" else "", if fast_Plot_1_minute>=slow_Plot_1_minute then color.green else if fast_Plot_1_minute<slow_Plot_1_minute then color.white else color.gray);

AddLabel(two_minute_label, "2 minute", Color.orange);
addlabel(two_minute_label , if fast_Plot_2_minute>=slow_Plot_2_minute then "Golden Cross " + barssince(crossup_2m) + " bars ago" else if fast_Plot_2_minute<slow_Plot_2_minute then "Death Cross " + barssince(crossdn_2m) + " bars ago" else "", if fast_Plot_2_minute>=slow_Plot_2_minute then color.green else if fast_Plot_2_minute<slow_Plot_2_minute then color.white else color.gray);

AddLabel(five_minute_label, "5 minute", Color.orange);
addlabel(five_minute_label, if fast_Plot_5_minute>=slow_Plot_5_minute then "Golden Cross " + barssince(crossup_5m) + " bars ago" else if fast_Plot_5_minute<slow_Plot_5_minute then "Death Cross " + barssince(crossdn_5m) + " bars ago" else "", if fast_Plot_5_minute>=slow_Plot_5_minute then color.green else if fast_Plot_5_minute<slow_Plot_5_minute then color.white else color.gray);

AddLabel(ten_minute_label, "10 minute", Color.orange);
addlabel(ten_minute_label, if fast_Plot_10_minute>=slow_Plot_10_minute then "Golden Cross " + barssince(crossup_10m) + " bars ago" else if fast_Plot_10_minute<slow_Plot_10_minute then "Death Cross " + barssince(crossdn_10m) + " bars ago" else "", if fast_Plot_10_minute>=slow_Plot_10_minute then color.green else if fast_Plot_10_minute<slow_Plot_10_minute then color.white else color.gray);

AddLabel(fifteen_minute_label, "15 minute", Color.orange);
addlabel(fifteen_minute_label, if fast_Plot_15_minute>=slow_Plot_15_minute then "Golden Cross " + barssince(crossup_15m) + " bars ago" else if fast_Plot_15_minute<slow_Plot_15_minute then "Death Cross " + barssince(crossdn_15m) + " bars ago" else "", if fast_Plot_15_minute>=slow_Plot_15_minute then color.green else if fast_Plot_15_minute<slow_Plot_15_minute then color.white else color.gray);

AddLabel(thirty_minute_label, "30 minute", Color.orange);
addlabel(thirty_minute_label, if fast_Plot_30_minute>=slow_Plot_30_minute then "Golden Cross " + barssince(crossup_30m) + " bars ago" else if fast_Plot_30_minute<slow_Plot_30_minute then "Death Cross " + barssince(crossdn_30m) + " bars ago" else "", if fast_Plot_30_minute>=slow_Plot_30_minute then color.green else if fast_Plot_30_minute<slow_Plot_30_minute then color.white else color.gray);

AddLabel(one_hour_label, "1 hour", Color.orange);
addlabel(one_hour_label, if fast_Plot_1_hr>=slow_Plot_1_hr then "Golden Cross " + barssince(crossup_1hr) + " bars ago" else if fast_Plot_1_hr<slow_Plot_1_hr then "Death Cross " + barssince(crossdn_1hr) + " bars ago" else "", if fast_Plot_1_hr>=slow_Plot_1_hr then color.green else if fast_Plot_1_hr<slow_Plot_1_hr then color.white else color.gray);

AddLabel(two_hour_label, "2 hour", Color.orange);
addlabel(two_hour_label, if fast_Plot_2_hr>=slow_Plot_2_hr then "Golden Cross " + barssince(crossup_2hr) + " bars ago" else if fast_Plot_2_hr<slow_Plot_2_hr then "Death Cross " + barssince(crossdn_2hr) + " bars ago" else "", if fast_Plot_2_hr>=slow_Plot_2_hr then color.green else if fast_Plot_2_hr<slow_Plot_2_hr then color.white else color.gray);

AddLabel(four_hour_label, "4 hour", Color.orange);
addlabel(four_hour_label, if fast_Plot_4_hr>=slow_Plot_4_hr then "Golden Cross " + barssince(crossup_4hr) + " bars ago" else if fast_Plot_4_hr<slow_Plot_4_hr then "Death Cross " + barssince(crossdn_4hr) + " bars ago" else "", if fast_Plot_4_hr>=slow_Plot_4_hr then color.green else if fast_Plot_4_hr<slow_Plot_4_hr then color.white else color.gray);

AddLabel(one_day_label, "1 day", Color.orange);
addlabel(one_day_label, if fast_Plot_day>=slow_Plot_day then "Golden Cross " + barssince(crossup_1day) + " bars ago" else if fast_Plot_day<slow_Plot_day then "Death Cross " + barssince(crossdn_1day) + " bars ago" else "", if fast_Plot_day>=slow_Plot_day then color.green else if fast_Plot_day<slow_Plot_day then color.white else color.gray);

AddLabel(five_day_label, "1 week", Color.orange);
addlabel(five_day_label, if fast_Plot_week>=slow_Plot_week then "Golden Cross " + barssince(crossup_1week) + " bars ago" else if fast_Plot_week<slow_Plot_week then "Death Cross " + barssince(crossdn_1week) + " bars ago" else "", if fast_Plot_week>=slow_Plot_week then color.green else if fast_Plot_week<slow_Plot_week then color.white else color.gray);

AddLabel(one_month_label, "1 month", Color.orange);
addlabel(one_month_label, if fast_Plot_month>=slow_Plot_month then "Golden Cross " + barssince(crossup_1month) + " bars ago" else if fast_Plot_month<slow_Plot_month then "Death Cross " + barssince(crossdn_1month) + " bars ago" else "", if fast_Plot_month>=slow_Plot_month then color.green else if fast_Plot_month<slow_Plot_month then color.white else color.gray);

AddLabel(one_year_label, "1 year", Color.orange);
addlabel(one_year_label,  if fast_Plot_year>=slow_Plot_year then "Golden Cross " + barssince(crossup_1year) + " bars ago" else if fast_Plot_year<slow_Plot_year then "Death Cross " + barssince(crossdn_1year) + " bars ago" else "", if fast_Plot_year>=slow_Plot_year then color.green else if fast_Plot_year<slow_Plot_year then color.white else color.gray);
 

Attachments

  • dfsdfds.png
    dfsdfds.png
    16.4 KB · Views: 274
  • zxcxzc.png
    zxcxzc.png
    555.7 KB · Views: 269
Last edited:
Hi, is this what you had in mind? I added options to hide the labels or arrows if you want.

View attachment 17713

Here is the link and code: http://tos.mx/oiHtRoD

Code:
## Golden and Death Cross indicator
## Coded by Chemmy at usethinkscript.com

input src = close;
input fast = 50;
input slow = 200;
input avgtype = AverageType.SIMPLE;
input color_bars = yes;
input show_bubbles = yes;
input show_arrows = yes;

def bn = barnumber();

script barssince {
    input Condition = 0;
    def barssince = if Condition then 1 else barssince[1] + 1;
    plot return = barssince;
}

plot fastma = MovingAverage(avgtype, src, fast);
plot slowma = MovingAverage(avgtype, src, slow);

fastma.setdefaultcolor(color.light_green);
slowma.setdefaultcolor(color.red);

assignpricecolor(if color_bars then (if fastma>=slowma then color.green else color.red) else color.current);

def crossup = fastma crosses above slowma ;
def crossdn = fastma crosses below slowma;

def uplabel = if show_bubbles and crossup then slowma else double.nan;
def dnlabel = if show_bubbles and crossdn then slowma else double.nan;

AddChartBubble(crossup, uplabel, "Golden", Color.GREEN, no);
AddChartBubble(crossdn, dnlabel, "Death", Color.RED, no);

plot up = show_arrows and crossup;
plot dn = show_arrows and crossdn;
up.setpaintingstrategy(paintingstrategy.boolean_arrow_up);
dn.setpaintingstrategy(paintingstrategy.boolean_arrow_down);
up.setdefaultcolor(color.light_green);
dn.setdefaultcolor(color.light_red);

addlabel(yes, if fastma>=slowma then "Golden Cross " + barssince(crossup) + " bars ago" else if fastma<slowma then "Death Cross " + barssince(crossdn) + " bars ago" else "",
 if fastma>=slowma then color.green else if fastma<slowma then color.red else color.gray);


# END CODE
Can you add codes for showing the price where the cross occurs?
 
Can you add codes for showing the price where the cross occurs?
Run this script. 👇


## Golden and Death Cross indicator
## Coded by Chemmy at usethinkscript.com

input src = close;
input fast = 50;
input slow = 200;
input avgtype = AverageType.SIMPLE;
input color_bars = yes;
input show_bubbles = yes;
input show_arrows = yes;

def bn = barnumber();

script barssince {
input Condition = 0;
def barssince = if Condition then 1 else barssince[1] + 1;
plot return = barssince;
}

plot fastma = MovingAverage(avgtype, src, fast);
plot slowma = MovingAverage(avgtype, src, slow);

fastma.setdefaultcolor(color.light_green);
slowma.setdefaultcolor(color.red);

assignpricecolor(if color_bars then (if fastma>=slowma then color.green else color.red) else color.current);

def crossup = fastma crosses above slowma;
def crossdn = fastma crosses below slowma;

def uplabel = if show_bubbles and crossup then slowma else double.nan;
def dnlabel = if show_bubbles and crossdn then slowma else double.nan;

AddChartBubble(crossup, uplabel, "Golden", Color.GREEN, no);
AddChartBubble(crossdn, dnlabel, "Death", Color.RED, no);

plot up = show_arrows and crossup;
plot dn = show_arrows and crossdn;
up.setpaintingstrategy(paintingstrategy.boolean_arrow_up);
dn.setpaintingstrategy(paintingstrategy.boolean_arrow_down);
up.setdefaultcolor(color.light_green);
dn.setdefaultcolor(color.light_red);

def crossup_price = if show_bubbles and crossup then slowma else double.nan;
def crossdn_price = if show_bubbles and crossdn then slowma else double.nan;

AddChartBubble(crossup, crossup_price, "$" + slowma, Color.GREEN, yes);
AddChartBubble(crossdn, crossdn_price, "$" + slowma, Color.RED, yes);

addlabel(
yes,
if fastma >= slowma then "Golden Cross " + barssince(crossup) + " bars ago" else if fastma < slowma then "Death Cross " + barssince(crossdn) + " bars ago" else "",
if fastma >= slowma then color.green else if fastma < slowma then color.red else color.gray
);

# END CODE
Thanks, I wanted chartbubble on the price candle not the addlabel with the price. Can you add chartbubble on the price candle where the golden cross occurs?
 
Last edited:
You've set me down a rabbit hole. I've updated some scripts,created new ones because of this thread.


I've now got a custom death cross moving average study that uses the Triangle Moving average.

https://tos.mx/MZHbJaX'


Idea is to wait until the candles cross through & up the red plot line and then sell before it goes through and below the plot line that turned green. Use the 20m chart.

https://usethinkscript.com/threads/command-center-for-thinkorswim-trading.16100/

Use this flex chart for a command like setup to tell you how much money you'll lose or gain depending on how much budget money you've configured the center labels to.

The cyan label tells you how much you'll gain or lose if you sell at the triangle moving average plot line.
 

Attachments

  • vbvcbvcbc.png
    vbvcbvcbc.png
    482.2 KB · Views: 249
@majidg try this version I just modified as I was also wanting the bubbles on the candle itself.

Notes:

  • Added bubbles to price bars with same price value as gold/death cross points
  • Removed arrow indicators as they interfere with bubbles on price bars
  • Changed the color scheme to be ToS uptick/downtick/current as it's easier on the eyes
  • Added an alert ding for the crossup and crossdn events

Many thanks to @Chemmy for creating the original and @Trader4TOS for the updates.

Slight update: I realized the price bubble was showing the incorrect (slowma) price and the color scheme was conflicting/causing confusion if you have other indicators activated.

Code:
## Gold and Death Cross indicator
## Coded by Chemmy at usethinkscript.com
## Modified by Falkkor at usethinkscript.com
##

input src = close;
input fast = 50;
input slow = 200;
input avgtype = AverageType.SIMPLE;
input color_bars = yes;
input show_bubbles = yes;

def bn = barnumber();

script barssince {
input Condition = 0;
def barssince = if Condition then 1 else barssince[1] + 1;
plot return = barssince;
}

plot fastma = MovingAverage(avgtype, src, fast);
plot slowma = MovingAverage(avgtype, src, slow);

fastma.setdefaultcolor(color.CYAN);
slowma.setdefaultcolor(color.YELLOW);

assignpricecolor(if color_bars then (if fastma>=slowma then color.LIGHT_ORANGE else color.DARK_ORANGE) else color.CURRENT);

def crossup = fastma crosses above slowma;
def crossdn = fastma crosses below slowma;

def uplabel = if show_bubbles and crossup then slowma else double.nan;
def dnlabel = if show_bubbles and crossdn then slowma else double.nan;

AddChartBubble(crossup, uplabel, "Gold Cross", Color.LIGHT_ORANGE, no);
AddChartBubble(crossdn, dnlabel, "Death Cross", Color.DARK_ORANGE, no);

def crossup_price = if show_bubbles and crossup then slowma else double.nan;
def crossdn_price = if show_bubbles and crossdn then slowma else double.nan;

AddChartBubble(show_bubbles and crossup, low, "Buy@" + close, Color.LIGHT_ORANGE, no);
AddChartBubble(show_bubbles and crossdn, high, "Sell@" + close, Color.DARK_ORANGE, yes);

addlabel(
yes,
if fastma >= slowma then "Gold Cross " + barssince(crossup) + " Bars Ago" else if fastma < slowma then "Death Cross " + barssince(crossdn) + " Bars Ago" else "",
if fastma >= slowma then color.LIGHT_ORANGE else if fastma < slowma then color.DARK_ORANGE else color.CURRENT
);

Alert(crossup, "Gold Cross", Alert.BAR, Sound.DING);
Alert(crossdn, "Death Cross", Alert.BAR, Sound.DING);

# END CODE
 
Last edited by a moderator:

Join useThinkScript to post your question to a community of 21,000+ developers and traders.

Similar threads

Not the exact question you're looking for?

Start a new thread and receive assistance from our community.

87k+ Posts
516 Online
Create Post

Similar threads

Similar threads

The Market Trading Game Changer

Join 2,500+ subscribers inside the useThinkScript VIP Membership Club
  • Exclusive indicators
  • Proven strategies & setups
  • Private Discord community
  • ‘Buy The Dip’ signal alerts
  • Exclusive members-only content
  • Add-ons and resources
  • 1 full year of unlimited support

Frequently Asked Questions

What is useThinkScript?

useThinkScript is the #1 community of stock market investors using indicators and other tools to power their trading strategies. Traders of all skill levels use our forums to learn about scripting and indicators, help each other, and discover new ways to gain an edge in the markets.

How do I get started?

We get it. Our forum can be intimidating, if not overwhelming. With thousands of topics, tens of thousands of posts, our community has created an incredibly deep knowledge base for stock traders. No one can ever exhaust every resource provided on our site.

If you are new, or just looking for guidance, here are some helpful links to get you started.

What are the benefits of VIP Membership?
VIP members get exclusive access to these proven and tested premium indicators: Buy the Dip, Advanced Market Moves 2.0, Take Profit, and Volatility Trading Range. In addition, VIP members get access to over 50 VIP-only custom indicators, add-ons, and strategies, private VIP-only forums, private Discord channel to discuss trades and strategies in real-time, customer support, trade alerts, and much more. Learn all about VIP membership here.
How can I access the premium indicators?
To access the premium indicators, which are plug and play ready, sign up for VIP membership here.
Back
Top