Mike Webster's Really Simple Indicator (Webby's RSI) For ThinkOrSwim

malone1020

Member
VIP
Hi, all

Couldn't find this anywhere in here so I thought I would share. Mike originally wrote this for TradeStation but recently shared his translation via ThinkScript for TOS.

Per Mike Webster:

In 1978, the famous technician J. Welles Wilder Jr. introduced the Relative Strength Index (RSI) overbought/oversold indicator, which has become very popular. This RSI has nothing to do with that great invention. Webster's RSI (aka Webby's RSI or MW-RSI) is something the Stock Market Update uses to gauge the health of an uptrend. It's simply the percentage of the low vs. the 21-day moving average.

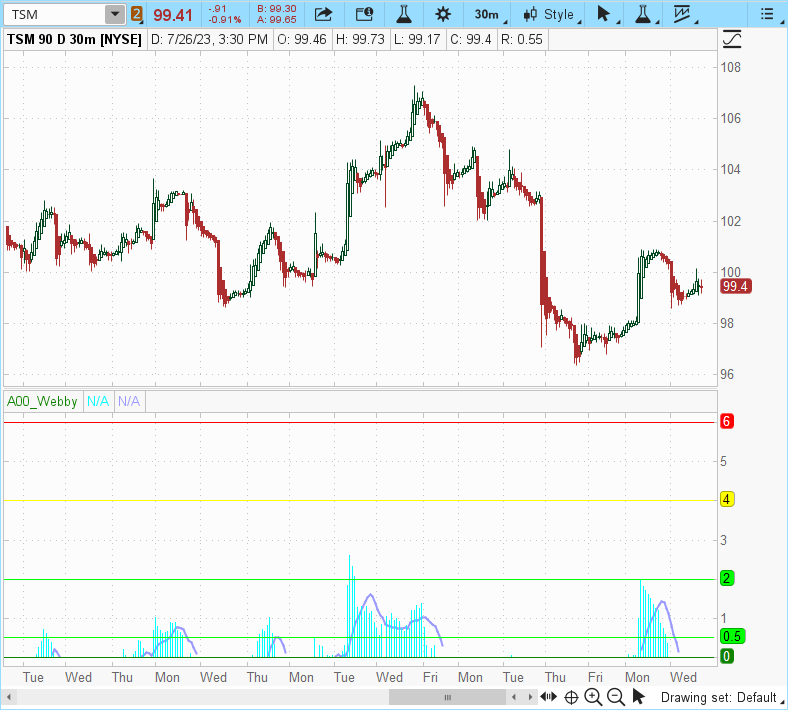
That's it. Therefore the name Really Simple Indicator (MW-RSI). The MW-RSI is plotted at the bottom of the chart. Because it's a bull market indicator, only positive values are shown. So if the low goes below the 21-day, no value will be displayed. The two green lines on the bottom represent the ideal, between 0.5% to 2.0% above the 21-day. The yellow line is 4.0% above the 21-day and the red line is 6.0% above.

The very beginning of a bull market should show power. This translates into high values. The higher, the better. You can see we had several days between 4% and 5%. Once the trend is established, the ideal area is between 0.5% and 2.0%.

Here is the lower indicator code:

Code:
# Webby's RSI (Really Simple Indicator)
# Plot percentage of the day's low vs 21-day EMA.
#
# More details on Webby's RSI
# https://www.investors.com/market-trend/stock-market-update-raging-bull-rests/
#
# Webby's RSI is featured each week in IBD's Weekend Stock Market Update
# https://www.investors.com/tag/weekend-stock-market-update/
#
# Webby's RSI was written by Mike Webster in EasyLanguage for TradeStation
# Follow Mike on Twitter: @mwebster1971 http://twitter.com/mwebster1971
#
# Ported to ThinkScript by John Muchow
# Follow John on Twitter: @JohnMuchow http://twitter.com/JohnMuchow
# Web: https://PlayTheTrade.com

#----------------------------------------------------------
# Setup
#----------------------------------------------------------
# Show data in lower window
declare lower;

# Calculate 21-day EMA of close
def _21DayExpMovingAverage = ExpAverage(close, 21);

# Webby RSI data point - percent of day's low vs 21-day EMA
def lowVs21DayMovingAverage = (((low - _21DayExpMovingAverage) / close) * 100);

# Calculate simple moving average of data points over 10 days
def _10DayMovingAverage = Average(lowVs21DayMovingAverage, 10);

#----------------------------------------------------------
# Show lines on graph at various intervals
#----------------------------------------------------------
plot _0Line = 0;
_0Line.HideTitle();

plot _pt5Line = .5;
_pt5Line.setDefaultColor(Color.GREEN);
_pt5Line.HideTitle();

plot _2line = 2;
_2line.setDefaultColor(Color.GREEN);
_2line.HideTitle();

plot _4line = 4;
_4line.setDefaultColor(Color.YELLOW);
_4line.HideTitle();

plot _6Line = 6;
_6Line.setDefaultColor(Color.RED);
_6line.HideTitle();

#----------------------------------------------------------
# Plot histogram for Webby RSI, ignoring negative values
#----------------------------------------------------------
def isPointNegative = Sign(lowVs21DayMovingAverage) == -1;
plot histogram = if !isPointNegative then AbsValue(lowVs21DayMovingAverage) else double.nan;
histogram.SetPaintingStrategy(PaintingStrategy.HISTOGRAM);
histogram.setDefaultColor(Color.CYAN);

#----------------------------------------------------------
# Plot line showing moving average across the histogram
#----------------------------------------------------------
def isMovingAveragePointNegative = Sign(_10DayMovingAverage) == -1;
plot line = if !isMovingAveragePointNegative then AbsValue(_10DayMovingAverage) else double.nan;
line.setDefaultColor(Color.VIOLET);
line.setLineWeight(2);
 
Last edited by a moderator:
@malone1020 thanks for sharing.

For discussion, is it correct to say that to scan for the beginning of the uptrend, we can scan for the moving average crossing above the 0.5 line?
 
@malone1020 Can this indicator be calculated to catch bullish moves at the 10 MA? Correct me if i'm wrong. I notice the indicator shows bullish moves only above the 50 MA.
 
Last edited by a moderator:
@MerryDay Thanks for your response. I used this particular indicator for bullish trends. I was wondering if there was a way this indicator could be made bearish as well. I hope this makes sense. i separate indicator but bearish.
Modified to included a red histogram for bearish:

Code:
# Webby's RSI is featured each week in IBD's Weekend Stock Market Update
# https://www.investors.com/tag/weekend-stock-market-update/
#
# Webby's RSI was written by Mike Webster in EasyLanguage for TradeStation
# Follow Mike on Twitter: @mwebster1971 http://twitter.com/mwebster1971
#
# Ported to ThinkScript by John Muchow
# Follow John on Twitter: @JohnMuchow http://twitter.com/JohnMuchow
# Web: https://PlayTheTrade.com

#----------------------------------------------------------
# Setup
#----------------------------------------------------------
# Show data in lower window
declare lower;

# Calculate 21-day EMA of close
def _21DayExpMovingAverage = ExpAverage(close, 21);

# Webby RSI data point - percent of day's low vs 21-day EMA
def lowVs21DayMovingAverage = (((low - _21DayExpMovingAverage) / close) * 100);

# Calculate simple moving average of data points over 10 days
def _10DayMovingAverage = Average(lowVs21DayMovingAverage, 10);

#----------------------------------------------------------
# Show lines on graph at various intervals
#----------------------------------------------------------
plot _0Line = 0;
_0Line.HideTitle();

plot _pt5Line = .5;
_pt5Line.setDefaultColor(Color.GREEN);
_pt5Line.HideTitle();

plot _2line = 2;
_2line.setDefaultColor(Color.GREEN);
_2line.HideTitle();

plot _4line = 4;
_4line.setDefaultColor(Color.YELLOW);
_4line.HideTitle();

plot _6Line = 6;
_6Line.setDefaultColor(Color.RED);
_6line.HideTitle();

#----------------------------------------------------------
# Plot histogram for Webby RSI, ignoring negative values
#----------------------------------------------------------
def isPointNegative = Sign(lowVs21DayMovingAverage) == -1;
plot histogram = if !isPointNegative then AbsValue(lowVs21DayMovingAverage) else double.nan;
histogram.SetPaintingStrategy(PaintingStrategy.HISTOGRAM);
histogram.setDefaultColor(Color.CYAN);


#----------------------------------------------------------
# Plot line showing moving average across the histogram
#----------------------------------------------------------
def isMovingAveragePointNegative = Sign(_10DayMovingAverage) == -1;
plot line = if !isMovingAveragePointNegative then AbsValue(_10DayMovingAverage) else double.nan;
line.setDefaultColor(Color.VIOLET);
line.setLineWeight(2);


#----------------------------------------------------------
# Added code below for bearish
#----------------------------------------------------------
def highVs21DayMovingAverage = (((_21DayExpMovingAverage - high) / close) * 100);
def _10DayMovingAverageBear = Average(highVs21DayMovingAverage, 10);

def isPointNegativeBear = Sign(highVs21DayMovingAverage) == -1; ### -1 or 1
plot histogramBear = if !isPointNegativeBear then AbsValue(highVs21DayMovingAverage) else double.nan;
histogramBear.SetPaintingStrategy(PaintingStrategy.HISTOGRAM);
histogramBear.setDefaultColor(Color.RED);

def isMovingAveragePointNegativeBear = Sign(_10DayMovingAverageBear) == -1; ### -1 or 1
plot lineBear = if !isMovingAveragePointNegativeBear then AbsValue(_10DayMovingAverageBear) else double.nan;
lineBear.setDefaultColor(Color.Pink);
lineBear.setLineWeight(2);
 
Not plotting for me.... I get four colored horizontal lines nothing else
You did not provide enough information to say where you went astray.
Here is a shared chart link with the indicator plotting on it, to get you started:
http://tos.mx/lf7EqNr
Click here for --> Easiest way to load shared links
L3zg0I3.png
 

Join useThinkScript to post your question to a community of 21,000+ developers and traders.

Not the exact question you're looking for?

Start a new thread and receive assistance from our community.

87k+ Posts
481 Online
Create Post

The Market Trading Game Changer

Join 2,500+ subscribers inside the useThinkScript VIP Membership Club
  • Exclusive indicators
  • Proven strategies & setups
  • Private Discord community
  • ‘Buy The Dip’ signal alerts
  • Exclusive members-only content
  • Add-ons and resources
  • 1 full year of unlimited support

Frequently Asked Questions

What is useThinkScript?

useThinkScript is the #1 community of stock market investors using indicators and other tools to power their trading strategies. Traders of all skill levels use our forums to learn about scripting and indicators, help each other, and discover new ways to gain an edge in the markets.

How do I get started?

We get it. Our forum can be intimidating, if not overwhelming. With thousands of topics, tens of thousands of posts, our community has created an incredibly deep knowledge base for stock traders. No one can ever exhaust every resource provided on our site.

If you are new, or just looking for guidance, here are some helpful links to get you started.

What are the benefits of VIP Membership?
VIP members get exclusive access to these proven and tested premium indicators: Buy the Dip, Advanced Market Moves 2.0, Take Profit, and Volatility Trading Range. In addition, VIP members get access to over 50 VIP-only custom indicators, add-ons, and strategies, private VIP-only forums, private Discord channel to discuss trades and strategies in real-time, customer support, trade alerts, and much more. Learn all about VIP membership here.
How can I access the premium indicators?
To access the premium indicators, which are plug and play ready, sign up for VIP membership here.
Back
Top