Median Proximity Percentile For ThinkOrSwim

Mark1126

New member
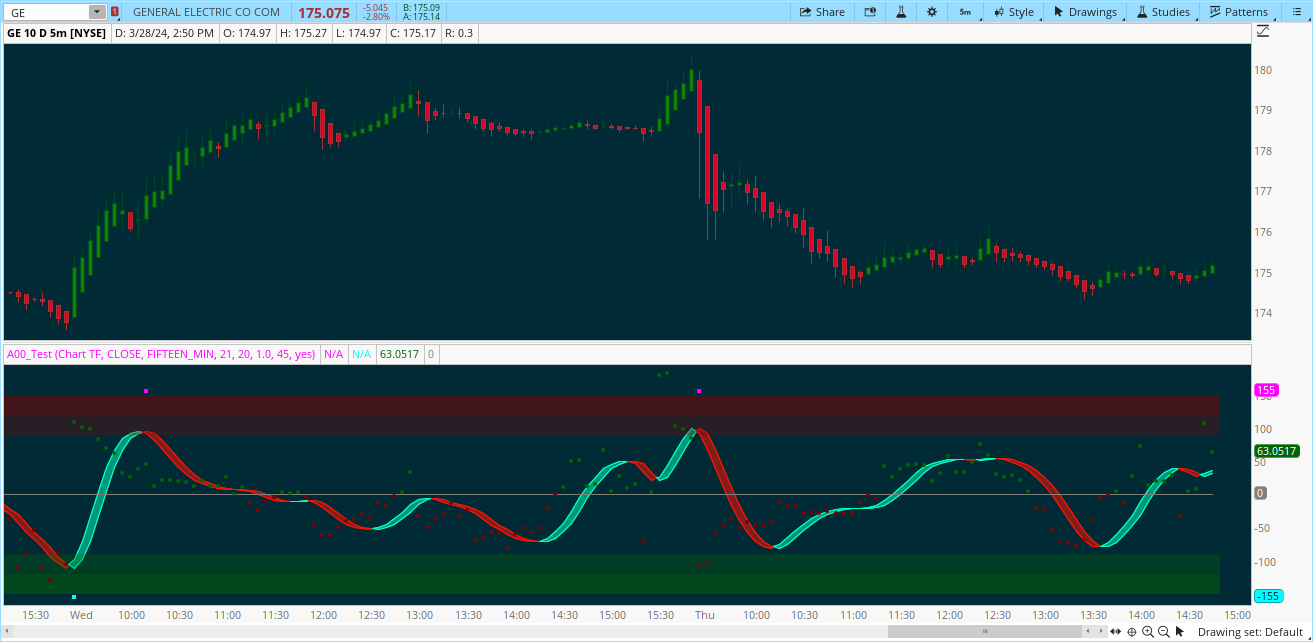
I believe the design concept is interesting and the indicator visual is simplistic, yet timely and effective.

The "Median Proximity Percentile" by AlgoAlpha, a dynamic and sophisticated trading indicator designed to enhance your market analysis. This tool efficiently tracks median price proximity over a specified lookback period and finds it's percentile between 2 dynamic standard deviation bands, offering valuable insights for traders looking to make informed decisions.

If the dots are green then it means the general trend is up and vice versa for red. If the dots cross the main plot that could be another indication that the main plot is about to change directions too.
eRLewI9.png


https://www.tradingview.com/script/YEu4VVBj-Median-Proximity-Percentile-AlgoAlpha/
Perhaps @samer800 could have a look.
 
Last edited by a moderator:

Join useThinkScript to post your question to a community of 21,000+ developers and traders.

Perhaps @samer800 could have a look. I believe the design concept is interesting and the indicator visual is simplistic, yet timely and effective.

The "Median Proximity Percentile" by AlgoAlpha, a dynamic and sophisticated trading indicator designed to enhance your market analysis. This tool efficiently tracks median price proximity over a specified lookback period and finds it's percentile between 2 dynamic standard deviation bands, offering valuable insights for traders looking to make informed decisions.

If the dots are green then it means the general trend is up and vice versa for red. If the dots cross the main plot that could be another indication that the main plot is about to change directions too.

https://www.tradingview.com/script/YEu4VVBj-Median-Proximity-Percentile-AlgoAlpha/

// This Pine Script™ code is subject to the terms of the Mozilla Public License 2.0 at https://mozilla.org/MPL/2.0/
// © AlgoAlpha
//@version=5
indicator("Median Proximity Percentile [AlgoAlpha]", "AlgoAlpha - % Median Proximity Percentile", overlay = false, timeframe = "", timeframe_gaps = false)
// Inputs
priceSource = input.source(close, "Source")
lookbackLength = input.int(21, minval = 1, title = "Lookback Length")
emaLookbackLength = input.int(20, minval = 1, title = "HMA Lookback Length")
stdDevMultiplier = 1
noise = input.bool(true, "Noise Scatterplot")
colorUp = input.color(#00ffbb, title = "Up Color")
colorDown = input.color(#ff1100, title = "Down Color")
// Calculations
medianValue = ta.median(priceSource, lookbackLength)
priceDeviation = (priceSource - medianValue)
standardDeviation = ta.stdev(priceDeviation, 45)
normalizedValue = priceDeviation / (standardDeviation + standardDeviation)
positiveValues = normalizedValue > 0 ? normalizedValue : 0
negativeValues = normalizedValue < 0 ? normalizedValue : 0
upperBoundary = ta.ema(positiveValues, lookbackLength) + ta.stdev(positiveValues, lookbackLength) * stdDevMultiplier
lowerBoundary = ta.ema(negativeValues, lookbackLength) - ta.stdev(negativeValues, lookbackLength) * stdDevMultiplier
percentileValue = 100 * (normalizedValue - lowerBoundary)/(upperBoundary - lowerBoundary) - 50
emaValue = ta.hma(percentileValue, emaLookbackLength)
// Color Conditions
plotColor = percentileValue > 0 ? colorUp :
percentileValue < 0 ? colorDown : na
// Plots
plot(noise ? percentileValue : na, color = color.new(plotColor, 50), style = plot.style_circles)
hmaPlot = plot(emaValue, color = color.new(emaValue > emaValue[1] ? colorUp : colorDown, 40), title = "Hull MA")
hmaPlot1 = plot(emaValue[1], color = color.new(emaValue > emaValue[1] ? colorUp : colorDown, 40))
zeroLine = plot(0, color = color.gray, title = "Zero Line")
plotchar(ta.crossover(emaValue,emaValue[1]) ? emaValue : na, "Bullish Swing", char = "o", location = location.absolute, color = colorUp, size = size.tiny)
plotchar(ta.crossover(emaValue[1],emaValue) ? emaValue : na, "Bearish Swing", char = "o", location = location.absolute, color = colorDown, size = size.tiny)
plotchar(ta.crossunder(emaValue,emaValue[1]) and emaValue[1] > 90 ? 160 : na, "Bearish Reversal", char = "▼", location = location.absolute, color = colorDown, size = size.tiny)
plotchar(ta.crossunder(emaValue[1],emaValue) and emaValue[1] < -90 ? -160 : na, "Bullish Reversal", char = "▲", location = location.absolute, color = colorUp, size = size.tiny)
// Hidden Levels
maxLevelPlot = plot(150, display = display.none)
minLevelPlot = plot(-150, display = display.none)
upperMidLevelPlot = plot(90, display = display.none)
lowerMidLevelPlot = plot(-90, display = display.none)
// Fills
fill(maxLevelPlot, upperMidLevelPlot, top_value = 150, bottom_value = 90, top_color = color.new(colorDown, 50), bottom_color = color.new(chart.bg_color, 90))
fill(minLevelPlot, lowerMidLevelPlot, top_value = -90, bottom_value = -150, top_color = color.new(chart.bg_color, 90), bottom_color = color.new(colorUp, 50))
fill(hmaPlot, hmaPlot1, color.new(emaValue > emaValue[1] ? colorUp : colorDown, 40))
// Alerts
alertcondition(ta.crossover(emaValue, 0), "Bullish Trend Shift", "Median Proximity Percentile Crossover Zero Line")
alertcondition(ta.crossunder(emaValue, 0), "Bearish Trend Shift", "Median Proximity Percentile Crossunder Zero Line")
alertcondition(ta.crossover(emaValue,emaValue[1]), "Bullish Swing", "Median Proximity Percentile Swinging Upwards")
alertcondition(ta.crossover(emaValue[1],emaValue), "Bearish Swing", "Median Proximity Percentile Swinging Downwards")
alertcondition(ta.crossunder(emaValue,emaValue[1]) and emaValue[1] > 90, "Bearish Reversal", "Median Proximity Percentile Bearish Reversal")
alertcondition(ta.crossunder(emaValue[1],emaValue) and emaValue[1] < -90, "Bullish Reversal", "Median Proximity Percentile Bullish Reversal")
check the below:

CSS:
#// This Pine Script™ code is subject to the terms of the Mozilla Public License 2.0 at
#// © AlgoAlpha
#indicator("Median Proximity Percentile [AlgoAlpha]", "AlgoAlpha - % Median Proximity Percentile", overlay = f
# Converted by Sam4Cok@Samer800    - 03/2024
declare lower;

input timeframe = {Default "Chart TF", "Custom TF"};
input Source = FundamentalType.CLOSE; #, "Source")
input customTimeframe = AggregationPeriod.FIFTEEN_MIN;
input lookbackLength = 21; #, minval = 1, title = "Lookback Length")
input hmaLookbackLength = 20; #, minval = 1, title = "HMA Lookback Length")
input stdDevMultiplier = 1.0;
input stdDevLength = 45;
input noiseScatterplot = yes; #, "Noise Scatterplot")

def na = Double.NaN;
def last = IsNaN(close);
def priceSource;
Switch (timeframe) {
Case "Custom TF" :
    priceSource = Fundamental(FundamentalType = Source, Period = customTimeframe);
Default :
    priceSource = Fundamental(FundamentalType = Source);
}

DefineGlobalColor("Up", CreateColor(0, 255, 187)); # "Up Color"
DefineGlobalColor("Dn", CreateColor(255, 17, 0)); # "Down Color"

#// Calculations
def medianValue = Median(priceSource, lookbackLength);
def priceDeviation = (priceSource - medianValue);
def standardDeviation = StDev(priceDeviation, stdDevLength);
def normalizedValue = priceDeviation / (standardDeviation + standardDeviation);
def positiveValues = if normalizedValue > 0 then normalizedValue else 0;
def negativeValues = if normalizedValue < 0 then normalizedValue else 0;
def upperBoundary = ExpAverage(positiveValues, lookbackLength) + stdev(positiveValues, lookbackLength) * stdDevMultiplier;
def lowerBoundary = ExpAverage(negativeValues, lookbackLength) - stdev(negativeValues, lookbackLength) * stdDevMultiplier;
def percentileValue = 100 * (normalizedValue - lowerBoundary)/(upperBoundary - lowerBoundary) - 50;

def emaValue = HullMovingAvg(percentileValue, hmaLookbackLength);
#// Color Conditions
def Col = if percentileValue > 0 then  1 else
          if percentileValue < 0 then -1 else 0;

#// Plots
plot bear = if (emaValue Crosses Below emaValue[1]) and emaValue[1] > 90 then 155 else na; # "Bearish Reversal"
plot bull = if (emaValue[1] Crosses Below emaValue) and emaValue[1] < -90 then -155 else na; # "Bullish Reversal"
bear.SetPaintingStrategy(PaintingStrategy.SQUARES);
bull.SetPaintingStrategy(PaintingStrategy.SQUARES);
bear.SetDefaultColor(Color.MAGENTA);
bull.SetDefaultColor(Color.CYAN);

plot noiseLine = if noiseScatterplot and Col then percentileValue else na;
def hmaPlot = emaValue;     # "Hull MA")
def hmaPlot1 = emaValue[1];
plot zeroLine = if last then na else 0; # "Zero Line"

zeroLine.SetDefaultColor(Color.GRAY);
noiseLine.SetPaintingStrategy(PaintingStrategy.POINTS);
noiseLine.AssignValueColor(if col >0 then Color.DARK_GREEN else Color.DARK_RED);

AddCloud(hmaPlot, hmaPlot1, GlobalColor("Up"), GlobalColor("Dn"), yes);

AddCloud(if last[1] then na else 150, 120, Color.DARK_RED);
AddCloud(if last[1] then na else 150, 90, Color.DARK_RED);
AddCloud(if last[1] then na else -120,-150, Color.DARK_GREEN);
AddCloud(if last[1] then na else -90,-150, Color.DARK_GREEN);


#-- END of CODE
Thank you. Currently using on NQ trading on Simulator and compiling some trade stats. I notice this indicator helps to reduce commissions since it the visualization lends itself to waiting for the scatterplot color to align with trend. I appreciate you, thanks for coding.
 

Similar threads

Not the exact question you're looking for?

Start a new thread and receive assistance from our community.

87k+ Posts
417 Online
Create Post

Similar threads

Similar threads

The Market Trading Game Changer

Join 2,500+ subscribers inside the useThinkScript VIP Membership Club
  • Exclusive indicators
  • Proven strategies & setups
  • Private Discord community
  • ‘Buy The Dip’ signal alerts
  • Exclusive members-only content
  • Add-ons and resources
  • 1 full year of unlimited support

Frequently Asked Questions

What is useThinkScript?

useThinkScript is the #1 community of stock market investors using indicators and other tools to power their trading strategies. Traders of all skill levels use our forums to learn about scripting and indicators, help each other, and discover new ways to gain an edge in the markets.

How do I get started?

We get it. Our forum can be intimidating, if not overwhelming. With thousands of topics, tens of thousands of posts, our community has created an incredibly deep knowledge base for stock traders. No one can ever exhaust every resource provided on our site.

If you are new, or just looking for guidance, here are some helpful links to get you started.

What are the benefits of VIP Membership?
VIP members get exclusive access to these proven and tested premium indicators: Buy the Dip, Advanced Market Moves 2.0, Take Profit, and Volatility Trading Range. In addition, VIP members get access to over 50 VIP-only custom indicators, add-ons, and strategies, private VIP-only forums, private Discord channel to discuss trades and strategies in real-time, customer support, trade alerts, and much more. Learn all about VIP membership here.
How can I access the premium indicators?
To access the premium indicators, which are plug and play ready, sign up for VIP membership here.
Back
Top