Maximum Pain Indicator For ThinkOrSwim

Darth Tradicus

Member
VIP
Hey everybody,

This is a simple utility indicator I made for personal use that I've gotten kind of addicted to. I made a version of this for another indicator on the boards but wanted to make it a stand alone so I can add it anywhere.

The purpose of this indicator is to help you quickly identify where your maximum monetary risk(pain) is located at any given candle. With volatility growing/shrinking, the chart constantly adjusting candle lengths and price to fit the screen, and on crazy days like FOMC, it is sometimes hard to know or quickly figure out exactly where you need to be to play things safe.

https%3A//i.imgur.com/fY6RbOp.jpg[/img]']
fY6RbOp.jpg


Basically just enter your max risk in the settings. The dashes above/below the candle is your max risk measured from the candle close -dash above for shorts, dash below for longs. In the chart image above, max risk is set to .40 cents which figures to be approximately $20 on the contracts I trade (Delta approx. .50 cents). So a quick glance at the chart tells me exactly where a $20 loss is at.

I figured I'd share since it's helped me out a lot. Its great for trading breakouts and pullbacks, especially on faster candles. Quickly identify where your maximum pain is at in relation to the last swing low/high where you would typically put your stop. Helps to see if you need to play your stop tighter, give you peace of mind to make the trade if you see you have a lot of room, or help to quickly decide if a trade is too risky and you should stay out altogether.

Enjoy!
Code:
# Maximum Pain Indicator - Max Risk from Candle Close
# /Darth Tradicus
# Purpose: to quickly see where your max loss is in relation to where you want to place your stop.

input MaxRiskfromPurchase = .4;
def na = Double.NaN;
def bn = barnumber();

def MaxActualBULL = (close - MaxRiskfromPurchase);
def MaxActualBEAR = (close + MaxRiskfromPurchase);

def MABU = if bn == 1 then na else if close[0] then MaxActualBULL else MABU[1];

def MABE = if bn == 1 then na else if close[0] then MaxActualBEAR else MABE[1];

plot priceMAXup = MABU;
priceMAXup.SetPaintingStrategy(PaintingStrategy.HORIZONTAL);
priceMAXup.SetDefaultColor(Color.WHITE);

plot priceMAXdown = MABE;
priceMAXdown.SetPaintingStrategy(PaintingStrategy.HORIZONTAL);
priceMAXdown.SetDefaultColor(Color.WHITE);
 
Made a slight adjustment. Now every up candle has an adjustable max pain stop below it with a profit target of 2x above it and every down candle has a max pain stop above it with a 2x profit target below. Next best thing to not being able to draw a profit/loss box on chart, plus it's automatic (y)

Code:
# Target and Max Pain Indicator
# /Darth Tradicus
# Purpose: quickly marking each candle's maximum loss and profit target

input MaxRiskfromPurchase = .4;
def na = Double.NaN;
def bn = barnumber();

def BULLstop = (close - MaxRiskfromPurchase);
def BEARstop = (close + MaxRiskfromPurchase);

def ProfitLine = (2*MaxRiskfromPurchase);
def UPcandle = ((close - open) > 0);
def DOWNcandle = ((open - close) > 0);

def TargetlineBULL = (close + ProfitLine);
def TargetlineBEAR = (close - ProfitLine);

def setBULLstop = if bn == 1 then na else if close[0] then BULLstop else setBULLstop[1];
def setBEARstop = if bn == 1 then na else if close[0] then BEARstop else setBEARstop[1];

def setBULLtarget = if bn == 1 then na else if close[0] then TargetlineBULL else setBULLtarget[1];
def setBEARtarget = if bn == 1 then na else if close[0] then TargetlineBEAR else setBEARtarget[1];

plot MaxPainBULL = if UPcandle then setBULLstop else na;
MaxPainBULL.SetPaintingStrategy(PaintingStrategy.HORIZONTAL);
MaxPainBULL.SetDefaultColor(Color.WHITE);

plot MaxPainBEAR = if DOWNcandle then setBEARstop else na;
MaxPainBEAR.SetPaintingStrategy(PaintingStrategy.HORIZONTAL);
MaxPainBEAR.SetDefaultColor(Color.WHITE);

plot BULLtarget = if UPcandle then setBULLtarget else na;
BULLtarget.SetPaintingStrategy(PaintingStrategy.HORIZONTAL);
BULLtarget.SetDefaultColor(Color.WHITE);

plot BEARtarget = if DOWNcandle then setBEARtarget else na;
BEARtarget.SetPaintingStrategy(PaintingStrategy.HORIZONTAL);
BEARtarget.SetDefaultColor(Color.WHITE);
 
Nice work. Just a thought, you might want to turn it into S/R like bands to improve charting,
making it friendlier to read.
 
Last edited:
It’s a great indicator something I was looking for, but is there way to code this so it erases the previous dashes and only display them on last 2 candle so that the chart doesn’t look full of dashes? Thanks in advance.
 
Nice work. Just a thought, you might want to turn it into S/R like bands to improve charting,
making it friendlier to read.
I could make it with lines/bands instead of the dash stops but I think it would make the chart more confusing because the bands would make it appear as if your stop is moving rather than remaining at a specific level. You would probably need to mark off a horizontal line at the band under/above your candle. I threw this together just to show what it would look like-

Code:
#Maximum Pain and Target Banded Version /DarthTradicus

#MaximumPain = Dollars/Cents Amt for stop
Input MaximumPain = .4;

plot LONGstop = (close - MaximumPain);
LONGstop.SetPaintingStrategy(PaintingStrategy.LINE);
LONGstop.SetDefaultColor(Color.RED);

plot SHORTstop = (close + MaximumPain);
SHORTstop.SetPaintingStrategy(PaintingStrategy.LINE);
SHORTstop.SetDefaultColor(Color.RED);

plot LONGtarget = (close + (MaximumPain*2));
LONGtarget.SetPaintingStrategy(PaintingStrategy.LINE);
LONGtarget.SetDefaultColor(Color.GREEN);

plot SHORTtarget = (close - (MaximumPain*2));
SHORTtarget.SetPaintingStrategy(PaintingStrategy.LINE);
SHORTtarget.SetDefaultColor(Color.GREEN);
 
It’s a great indicator something I was looking for, but is there way to code this so it erases the previous dashes and only display them on last 2 candle so that the chart doesn’t look full of dashes? Thanks in advance.
Not a way that I know of. I think you would have to turn it into a repainting indicator somehow to erase previous markings or make markings temporary but I'm not sure how to do that. Another member might know.

Till then it'll have to just look like somebody sneezed on your chart :LOL:. It's actually only distracting to me if I try to color them- then it starts bugging me out with other indicators I'm using. So leaving them white or even darker gray against a dark background and vice versa keeps them from being as noticeable. It does come in handy for me having them all on there though when manually backtesting different indicators- where I woulda stopped out etc. Seems like I'm always looking at new ones on here...
 
Made a slight adjustment. Now every up candle has an adjustable max pain stop below it with a profit target of 2x above it and every down candle has a max pain stop above it with a 2x profit target below. Next best thing to not being able to draw a profit/loss box on chart, plus it's automatic (y)

Code:
# Target and Max Pain Indicator
# /Darth Tradicus
# Purpose: quickly marking each candle's maximum loss and profit target

input MaxRiskfromPurchase = .4;
def na = Double.NaN;
def bn = barnumber();

def BULLstop = (close - MaxRiskfromPurchase);
def BEARstop = (close + MaxRiskfromPurchase);

def ProfitLine = (2*MaxRiskfromPurchase);
def UPcandle = ((close - open) > 0);
def DOWNcandle = ((open - close) > 0);

def TargetlineBULL = (close + ProfitLine);
def TargetlineBEAR = (close - ProfitLine);

def setBULLstop = if bn == 1 then na else if close[0] then BULLstop else setBULLstop[1];
def setBEARstop = if bn == 1 then na else if close[0] then BEARstop else setBEARstop[1];

def setBULLtarget = if bn == 1 then na else if close[0] then TargetlineBULL else setBULLtarget[1];
def setBEARtarget = if bn == 1 then na else if close[0] then TargetlineBEAR else setBEARtarget[1];

plot MaxPainBULL = if UPcandle then setBULLstop else na;
MaxPainBULL.SetPaintingStrategy(PaintingStrategy.HORIZONTAL);
MaxPainBULL.SetDefaultColor(Color.WHITE);

plot MaxPainBEAR = if DOWNcandle then setBEARstop else na;
MaxPainBEAR.SetPaintingStrategy(PaintingStrategy.HORIZONTAL);
MaxPainBEAR.SetDefaultColor(Color.WHITE);

plot BULLtarget = if UPcandle then setBULLtarget else na;
BULLtarget.SetPaintingStrategy(PaintingStrategy.HORIZONTAL);
BULLtarget.SetDefaultColor(Color.WHITE);

plot BEARtarget = if DOWNcandle then setBEARtarget else na;
BEARtarget.SetPaintingStrategy(PaintingStrategy.HORIZONTAL);
BEARtarget.SetDefaultColor(Color.WHITE);
@Darth Tradicus I added this code a buy and sell signal and wanted to know is there a way to extend the MaxPain and Target horizontal line to the right a few bars or until price action touches ether line would be perfect???
 
@Darth Tradicus I added this code a buy and sell signal and wanted to know is there a way to extend the MaxPain and Target horizontal line to the right a few bars or until price action touches ether line would be perfect???
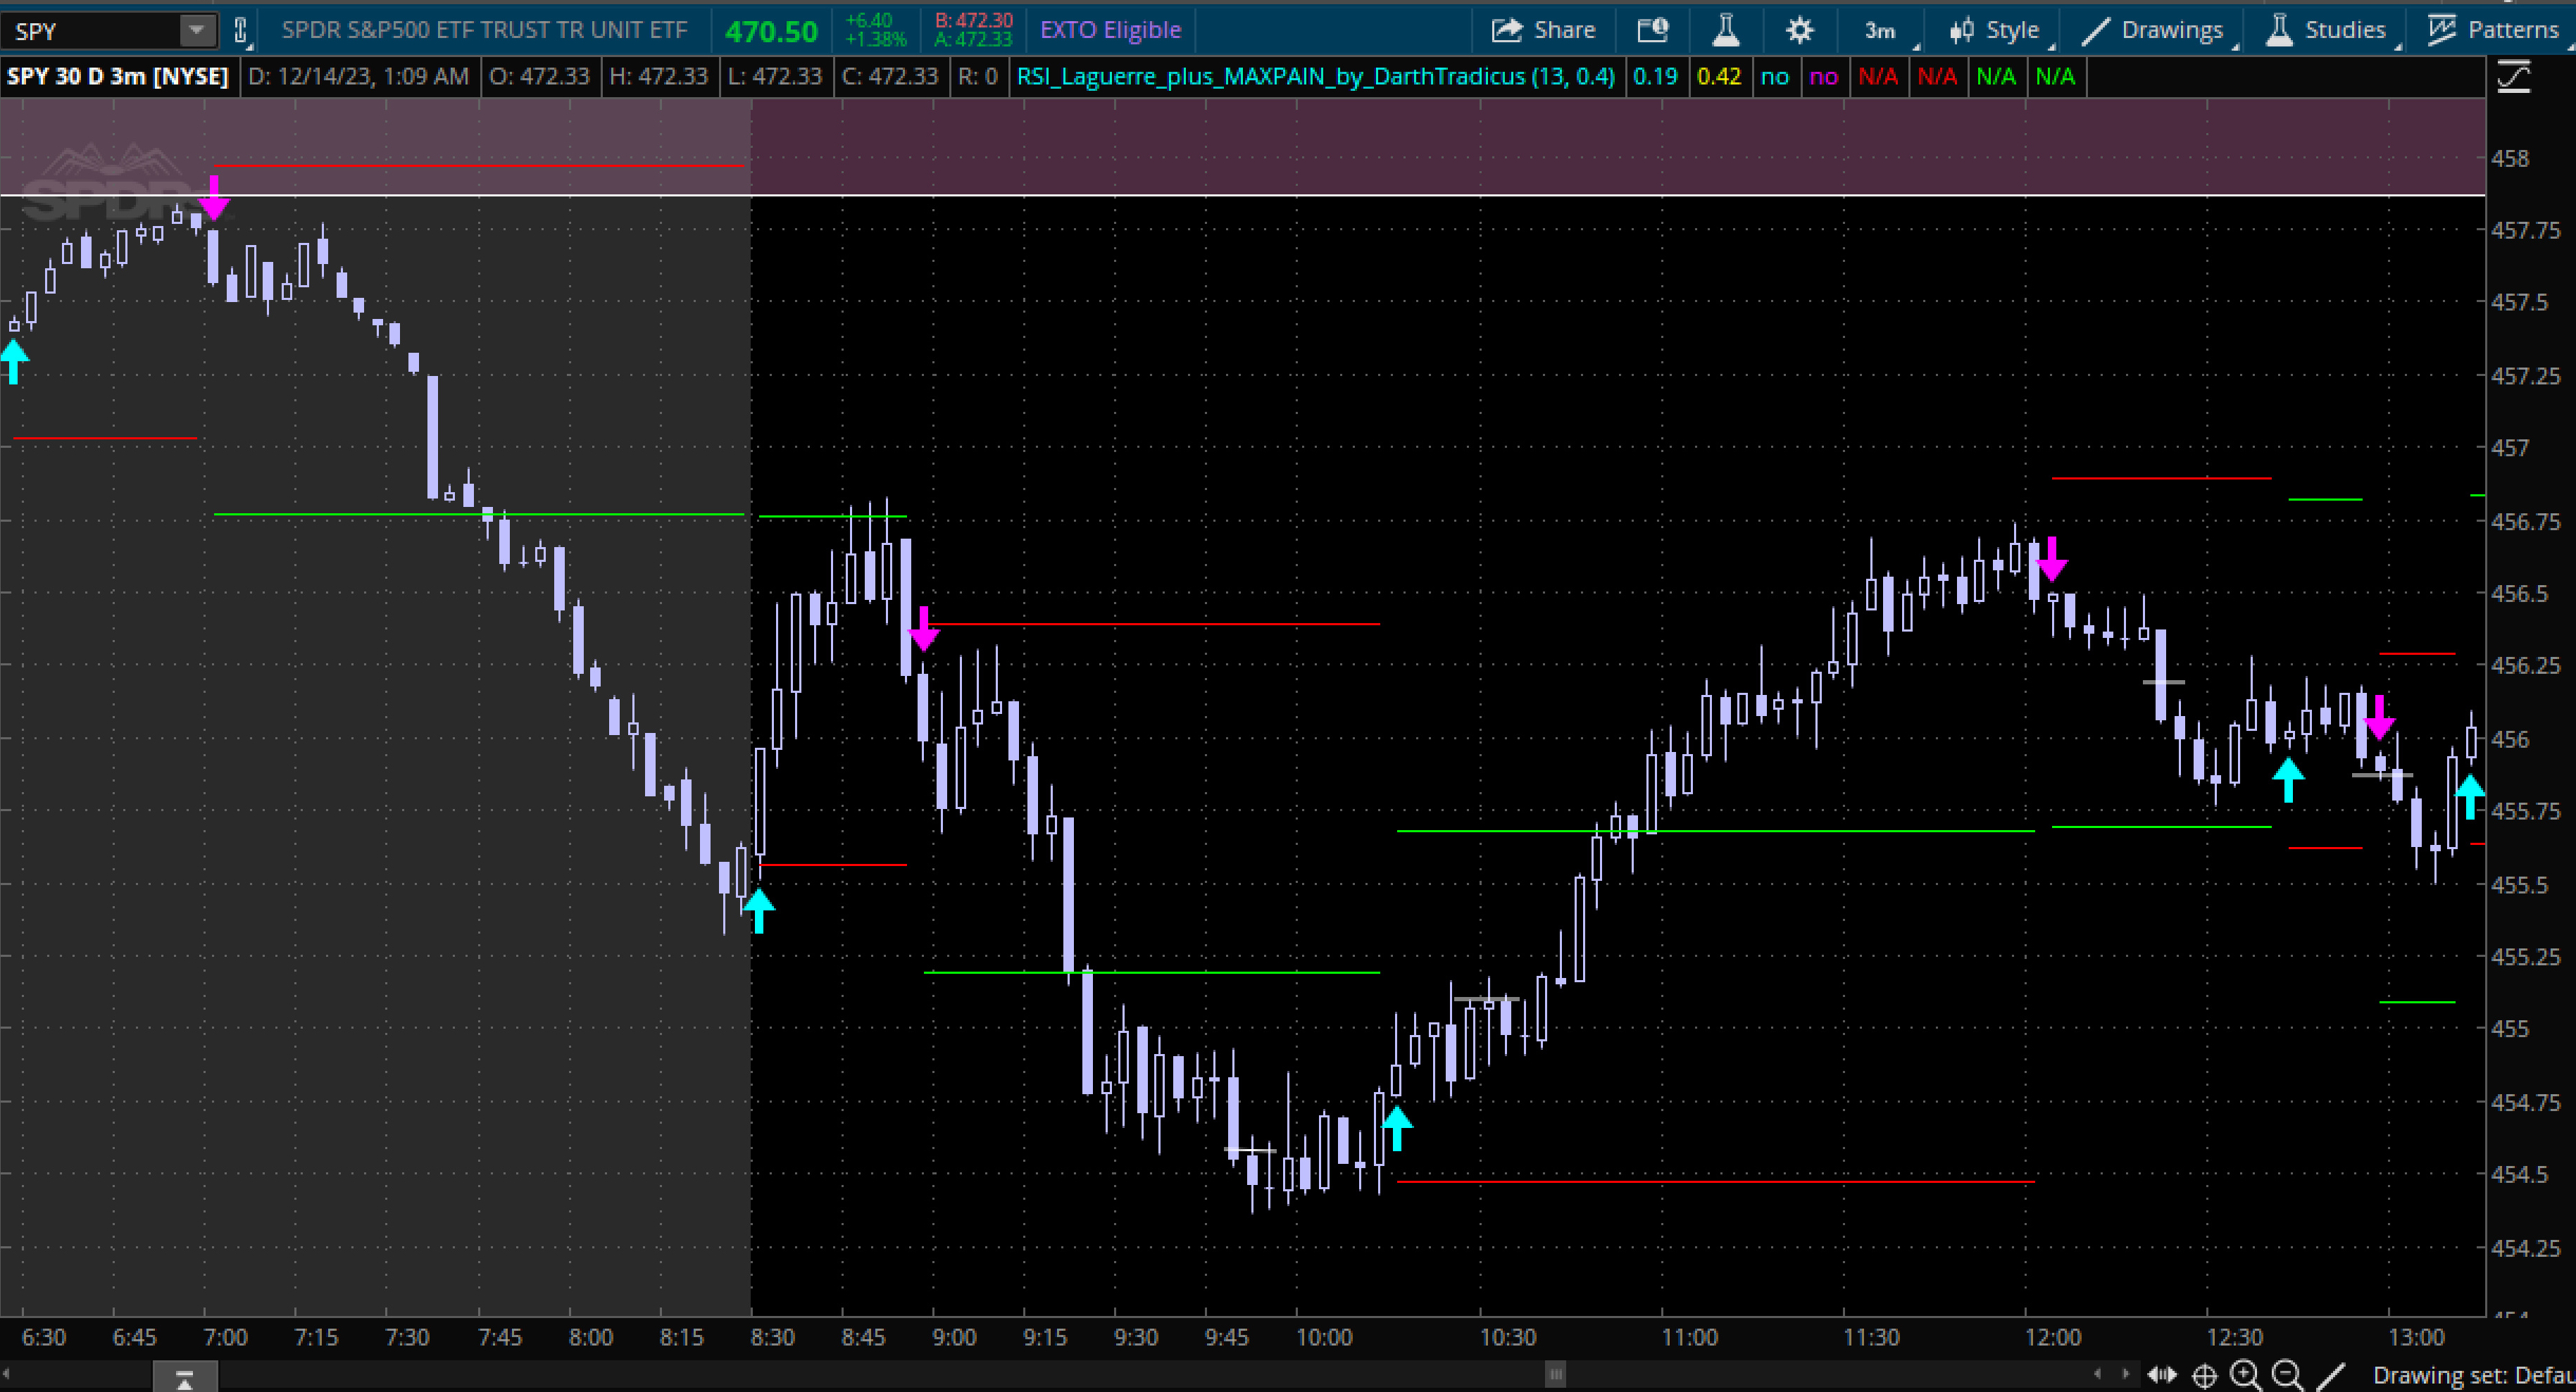
See if this works for you. I took the code for Mobius/Theotrade RSI Laguerre and plotted upper signal arrows. I then applied the Max Pain code to the signal arrow candle and made it so that the lines continue until the next trigger arrow is signaled. MaxPain set at $.40 with a 2x profit target adjustable in the code or setting menu. You'll just need to switch out whatever signal code you're using with the RSI Laguerre code and match up the conditions. PS shoutout to halcyonguy for his original code that I tweaked.

**EDIT - I added an extra gray line at entry/break even (not in the pic)
**EDIT - fixed error, line:
def pLINEbear = if bn == 1 or cross_below[-1] or cross_above then na else if cross_below

Code:
# //////////////////////////////////////////////////////
# TheoTrade RSI in Laguerre Time Self Adjusting With Fractal Energy
# Mobius
# V03.06.15.2016
# //////////////////////////////////////////////////////

#///////////////////////////////////////////////////////
#//////////////////////RSI GUTS/////////////////////////
#///////////////////////////////////////////////////////

#Inputs:
input nFE = 13;#hint nFE: length for Fractal Energy calculation.

# Variables:
def o;
def h;
def l;
def c;
def CU1;
def CU2;
def CU;
def CD1;
def CD2;
def CD;
def L0;
def L1;
def L2;
def L3;
plot RSI;
plot OS;
plot OB;

# Calculations
o = (open + close[1]) / 2;
h = Max(high, close[1]);
l = Min(low, close[1]);
c = (o + h + l + close) / 4;
plot gamma = Log(Sum((Max(high, close[1]) - Min(low, close[1])), nFE) /
        (Highest(high, nFE) - Lowest(low, nFE)))
            / Log(nFE);
gamma.SetDefaultColor(Color.Yellow);
L0 = (1 – gamma) * c + gamma * L0[1];
L1 = -gamma * L0 + L0[1] + gamma * L1[1];
L2 = -gamma * L1 + L1[1] + gamma * L2[1];
L3 = -gamma * L2 + L2[1] + gamma * L3[1];
if L0 >= L1
then {
    CU1 = L0 - L1;
    CD1 = 0;
} else {
    CD1 = L1 - L0;
    CU1 = 0;
}
if L1 >= L2
then {
    CU2 = CU1 + L1 - L2;
    CD2 = CD1;
} else {
    CD2 = CD1 + L2 - L1;
    CU2 = CU1;
}
if L2 >= L3
then {
    CU = CU2 + L2 - L3;
    CD = CD2;
} else {
    CU = CU2;
    CD = CD2 + L3 - L2;
}

RSI = if CU + CD <> 0 then CU / (CU + CD) else 0;
RSI.SetDefaultColor(Color.Cyan);
OS = if IsNaN(close) then Double.NaN else 0.2;
OS.SetDefaultColor(Color.Gray);
OS.HideBubble();
OS.HideTitle();
OB = if IsNaN(close) then Double.NaN else 0.8;
OB.SetDefaultColor(Color.Gray);
OB.HideBubble();
OB.HideTitle();
plot FEh = if isNaN(close) then double.nan else .618;
FEh.SetStyle(Curve.Long_Dash);
FEh.HideBubble();
FEh.SetDefaultColor(Color.Dark_Gray);
FEh.HideTitle();
plot FEl = if isNaN(close) then double.nan else .382;
FEl.SetStyle(Curve.Long_Dash);
FEl.SetDefaultColor(Color.Dark_Gray);
FEl.HideBubble();
FEl.HideTitle();
AddCloud(0, OS, Color.Green, Color.Green);
AddCloud(OB, 1, Color.Red, Color.Red);
#Alert(RSI crosses below .9, "", Alert.BAR, Sound.Bell);
#Alert(RSI crosses above .1, "", Alert.BAR, Sound.Bell);


# //////////////////////////////////////////////////////
# ///////////////Plot Upper Arrows//////////////////////
# //////////////////////////////////////////////////////

# RSI Primary Bullish/Bearish Trigger (CYAN/MAGENTA Arrows)

plot cross_above = RSI crosses above .2;
cross_above.SetPaintingStrategy(PaintingStrategy.BOOLEAN_ARROW_UP);
cross_above.SetDefaultColor(Color.CYAN);

plot cross_below = RSI crosses below .8;
cross_below.SetPaintingStrategy(PaintingStrategy.BOOLEAN_ARROW_DOWN);
cross_below.SetDefaultColor(Color.MAGENTA);

# //////////////////////////////////////////////////////
# ///////////////MAX PAIN CODE START////////////////////
# //////////////////////////////////////////////////////

input MaxRiskfromPurchase = .4;
def na = Double.NaN;
def bn = barnumber();

# set continuous stop line
def bull_stp = if bn == 1 or cross_above[-1] or cross_below then na else if cross_above then (close - MaxRiskfromPurchase) else bull_stp[1];

def bear_stp = if bn == 1 or cross_below[-1] or cross_above then na else if cross_below then (close + MaxRiskfromPurchase) else bear_stp[1];

# set continuous target line
def bull_tgt = if bn == 1 or cross_above[-1] or cross_below then na else if cross_above then (close + MaxRiskfromPurchase*2) else bull_tgt[1];

def bear_tgt = if bn == 1 or cross_below[-1] or cross_above then na else if cross_below then (close - MaxRiskfromPurchase*2) else bear_tgt[1];

# set continuous purchase line
def pLINEbull = if bn == 1 or cross_above[-1] or cross_below then na else if cross_above then close else pLINEbull[1];
def pLINEbear = if bn == 1 or cross_below[-1] or cross_above then na else if cross_below then close else pLINEbear[1];

#plot continuous lines
plot BULLstop = bull_stp;
BULLstop.SetDefaultColor(Color.red);

plot BEARstop = bear_stp;
BEARstop.SetDefaultColor(Color.red);

plot BULLtarget = bull_tgt;
BULLtarget.SetDefaultColor(Color.green);

plot BEARtarget = bear_tgt;
BEARtarget.SetDefaultColor(Color.green);

plot PurchaseLineBULL = pLINEbull;
PurchaseLineBULL.SetDefaultColor(Color.gray);

plot PurchaseLineBEAR = pLINEbear;
PurchaseLineBEAR.SetDefaultColor(Color.gray);

 
Last edited:

Join useThinkScript to post your question to a community of 21,000+ developers and traders.

Similar threads

Not the exact question you're looking for?

Start a new thread and receive assistance from our community.

87k+ Posts
564 Online
Create Post

Similar threads

Similar threads

The Market Trading Game Changer

Join 2,500+ subscribers inside the useThinkScript VIP Membership Club
  • Exclusive indicators
  • Proven strategies & setups
  • Private Discord community
  • ‘Buy The Dip’ signal alerts
  • Exclusive members-only content
  • Add-ons and resources
  • 1 full year of unlimited support

Frequently Asked Questions

What is useThinkScript?

useThinkScript is the #1 community of stock market investors using indicators and other tools to power their trading strategies. Traders of all skill levels use our forums to learn about scripting and indicators, help each other, and discover new ways to gain an edge in the markets.

How do I get started?

We get it. Our forum can be intimidating, if not overwhelming. With thousands of topics, tens of thousands of posts, our community has created an incredibly deep knowledge base for stock traders. No one can ever exhaust every resource provided on our site.

If you are new, or just looking for guidance, here are some helpful links to get you started.

What are the benefits of VIP Membership?
VIP members get exclusive access to these proven and tested premium indicators: Buy the Dip, Advanced Market Moves 2.0, Take Profit, and Volatility Trading Range. In addition, VIP members get access to over 50 VIP-only custom indicators, add-ons, and strategies, private VIP-only forums, private Discord channel to discuss trades and strategies in real-time, customer support, trade alerts, and much more. Learn all about VIP membership here.
How can I access the premium indicators?
To access the premium indicators, which are plug and play ready, sign up for VIP membership here.
Back
Top