Pabloadmin
New member
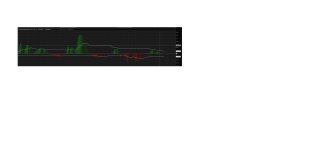
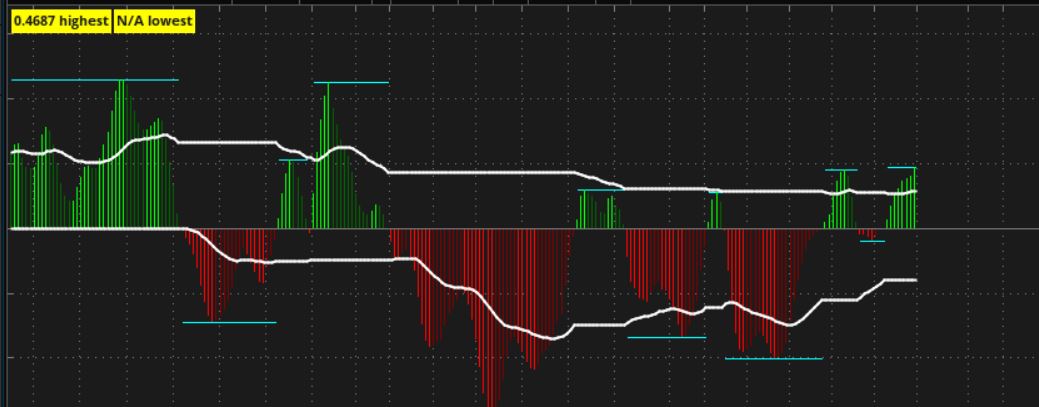
Hi, i trying to get the maximum and minimum relative values from the Elliot wave oscillator like the marks in the graph. Some body could help me? This is the code of ewo osc:
# Elliot Wave Oscillator with bands
#Horserider 5/17/2020
# Normal : Fast SMA 5 – Slow SMA 35
# Fast: Fast SMA 5 – Slow SMA 17
# Slow: Fast SMA 10 – Slow SMA 70
#
declare lower;
input price = hl2;
input HistoType = {default STD, ROC};
input SmoothLength = 7;
def valueDiff;
def value;
def showBands;
switch (HistoType) {
case STD:
value = double.nan;
valueDiff = (Average(price, 5) - Average(price, 34));
#valueDiff = (movAvgWeighted(price, 5) - movAvgWeighted(price, 35));
#valueDiff = (hullMovingAvg(price, 5) - hullMovingAvg(price, 35));
showBands = 1;
case ROC:
# ROC is smoothed with a SMA
value = (Average(price, 10) - Average(price, 70));
valueDiff = Average(value - value[1], SmoothLength);
showBands = 1;
}
# --- start Breakout Bands logic ---
#
# AdvanceGetOscillator Breakout Bands logic ported
# from [codebase.mql4.com]
# and [fxcodebase.com]...
def coeff_num = 2;
def coeff_denom = 39;
def barNum = if IsNaN( close ) then Double.NaN else barNumber();
def coeff = coeff_num / ( coeff_denom + 1 );
def diff = ValueDiff;
rec _upLine = if barNum == 1 then
if diff >= 0 then
diff * coeff + diff * ( 1 - Coeff )
else
0
else
if diff >= 0 then
diff * coeff + _upLine[1] * ( 1 - Coeff )
else
_upLine[1];
rec _dnLine = if barNum == 1 then
if diff < 0 then
diff * coeff + diff * ( 1 - Coeff )
else
0
else
if diff < 0 then
diff * coeff + _dnLine[1] * ( 1 - Coeff )
else
_dnLine[1];
plot UpLine = if showBands then _upLine else double.nan;
plot DownLine = if showBands then _dnLine else double.nan;
UpLine.SetDefaultColor(GetColor(9));
UpLine.SetLineWeight(2);
DownLine.SetDefaultColor(GetColor(9));
DownLine.SetLineWeight(2);
# --- end Breakout Band logic ---
plot ZeroLine = 0;
ZeroLine.SetDefaultColor(GetColor(7));
plot Osc = valueDiff;
plot UpSignal = if Diff crosses above ZeroLine then ZeroLine else Double.NaN;
plot DownSignal = if Diff crosses below ZeroLine then ZeroLine else Double.NaN;
Osc.SetDefaultColor(GetColor(5));
Osc.SetPaintingStrategy(PaintingStrategy.HISTOGRAM);
Osc.SetLineWeight(3);
Osc.DefineColor("Positive and Up", Color.GREEN);
Osc.DefineColor("Positive and Down", Color.DARK_GREEN);
Osc.DefineColor("Negative and Down", Color.RED);
Osc.DefineColor("Negative and Up", Color.DARK_RED);
Osc.AssignValueColor(if Osc >= 0 then if Osc > Osc[1] then Osc.color("Positive and Up") else Osc.color("Positive and Down") else if Osc < Osc[1] then Osc.color("Negative and Down") else Osc.color("Negative and Up"));