Mastering The Trade

AstroBoy

New member
@halcyonguy Hey I was wondering if you can help me with this Watchlist Column indicator I am working on?
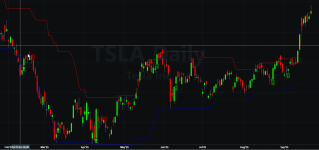
Taking a page from John Carter's book Mastering the Trade, this indicator seeks to look back at the previous 21 candles on any time frame to see what is the "Highest of the Low Period (HOLP)" and what is the "Lowest of the High Period (LOHP)"...... If the price closed below HOLP, it signals a sell, and vice-versa if price closes above LOHP it signals a buy...
This indicator works perfectly fine on a chart, however on a watchlist column, it isn't displaying correctly - - I am interested in whether the most recent signal during the trading day was a buy or a sell... But this is only telling me if the current candle is a buy or sell which is not what I want... I hope this makes sense.


Code:
input lookback = 21;

def lowBar = low == Lowest(low, lookback);
def HOLP = if lowBar then high else HOLP[1];
def closedAboveHOLP = if lowBar then 0 else if close > HOLP then closedAboveHOLP[1]+1 else closedAboveHOLP[1];
def buy = closedAboveHOLP == 1 and closedAboveHOLP[1] == 0;

def highBar = high == Highest(high, lookback);
def LOHP = if highBar then low else LOHP[1];
def closedBelowLOHP = if highBar then 0 else if close < LOHP then closedBelowLOHP[1]+1 else closedBelowLOHP[1];
def sell = closedBelowLOHP == 1 and closedBelowLOHP[1] == 0;

plot output = if buy then 1 else if sell then -1 else 0;
output.assignvaluecolor(if buy then color.dark_green else if sell then color.dark_red else color.yellow);
assignbackgroundcolor(if buy then color.dark_green else if sell then color.dark_red else color.yellow);
 
Last edited by a moderator:
Solution
@halcyonguy Hey I was wondering if you can help me with this Watchlist Column indicator I am working on?
Taking a page from John Carter's book Mastering the Trade, this indicator seeks to look back at the previous 21 candles on any time frame to see what is the "Highest of the Low Period (HOLP)" and what is the "Lowest of the High Period (LOHP)"...... If the price closed below HOLP, it signals a sell, and vice-versa if price closes above LOHP it signals a buy...
This indicator works perfectly fine on a chart, however on a watchlist column, it isn't displaying correctly - - I am interested in whether the most recent signal during the trading day was a buy or a sell... But this is only telling me if the...
@halcyonguy Hey I was wondering if you can help me with this Watchlist Column indicator I am working on?
Taking a page from John Carter's book Mastering the Trade, this indicator seeks to look back at the previous 21 candles on any time frame to see what is the "Highest of the Low Period (HOLP)" and what is the "Lowest of the High Period (LOHP)"...... If the price closed below HOLP, it signals a sell, and vice-versa if price closes above LOHP it signals a buy...
This indicator works perfectly fine on a chart, however on a watchlist column, it isn't displaying correctly - - I am interested in whether the most recent signal during the trading day was a buy or a sell... But this is only telling me if the current candle is a buy or sell which is not what I want... I hope this makes sense.


Code:
input lookback = 21;

def lowBar = low == Lowest(low, lookback);
def HOLP = if lowBar then high else HOLP[1];
def closedAboveHOLP = if lowBar then 0 else if close > HOLP then closedAboveHOLP[1]+1 else closedAboveHOLP[1];
def buy = closedAboveHOLP == 1 and closedAboveHOLP[1] == 0;

def highBar = high == Highest(high, lookback);
def LOHP = if highBar then low else LOHP[1];
def closedBelowLOHP = if highBar then 0 else if close < LOHP then closedBelowLOHP[1]+1 else closedBelowLOHP[1];
def sell = closedBelowLOHP == 1 and closedBelowLOHP[1] == 0;

plot output = if buy then 1 else if sell then -1 else 0;
output.assignvaluecolor(if buy then color.dark_green else if sell then color.dark_red else color.yellow);
assignbackgroundcolor(if buy then color.dark_green else if sell then color.dark_red else color.yellow);


this is a column study
it shows the number of bars since a signal.
positive numbers for buy , negative numbers for sell.
the cell is colored green or red.

column

link
zholcarter_0a
15min
http://tos.mx/jNrIBiQ

Code:
# zholcarter_0a

# hol_loh_carter_col_0a
# hol_loh_carter_lower_0b

# test, lower
# col from upper

#https://usethinkscript.com/threads/mastering-the-trade.12180/
# I am interested in whether the most recent signal during the trading day was a buy or a sell

#declare lower;

def bn = barnumber();
def na = double.nan;

input lookback = 21;

def lowBar = low == Lowest(low, lookback);
def HOLP = if lowBar then high else HOLP[1];
def closedAboveHOLP = if lowBar then 0 else if close > HOLP then closedAboveHOLP[1]+1 else closedAboveHOLP[1];
def buy = closedAboveHOLP == 1 and closedAboveHOLP[1] == 0;

def highBar = high == Highest(high, lookback);
def LOHP = if highBar then low else LOHP[1];
def closedBelowLOHP = if highBar then 0 else if close < LOHP then closedBelowLOHP[1]+1 else closedBelowLOHP[1];
def sell = closedBelowLOHP == 1 and closedBelowLOHP[1] == 0;

def output = if buy then 1 else if sell then -1 else 0;
#output.assignvaluecolor(if buy then color.dark_green else if sell then color.dark_red else color.yellow);

#assignbackgroundcolor(if buy then color.dark_green else if sell then color.dark_red else color.yellow);


def out2 =
     if bn == 1 then 0
else if buy then 1
else if sell then -1
else if out2[1] > 0 then out2[1] + 1
else if out2[1] < 0 then out2[1] - 1
else 0;

#addlabel(1, out2, (if out2 < 0 then color.red else if out2 > 0 then color.green else color.gray));
plot z = out2;
z.setdefaultcolor(color.black);

assignbackgroundcolor((if out2 < 0 then color.red else if out2 > 0 then color.green else color.gray));
#

column, showing how many bars back to a buy or sell
0UTZCd4.jpg


--------------------------------------

test studies

if a column study is desired, i usually make a lower, to verify the signals match those in the upper study.
then i modify a copy of the lower, and make a column.

upper
Code:
# hol_loh_carter_upper

# col from upper

#https://usethinkscript.com/threads/mastering-the-trade.12180/
#Mastering The Trade
# AstroBoy  Start dateToday at 6:08 PM

#@halcyonguy Hey I was wondering if you can help me with this Watchlist Column indicator I am working on?
#Taking a page from John Carter's book Mastering the Trade, this indicator seeks to look back at the previous 21 candles on any time frame to see what is the "Highest of the Low Period (HOLP)" and what is the "Lowest of the High Period (LOHP)"...... If the price closed below HOLP, it signals a sell, and vice-versa if price closes above LOHP it signals a buy...
#This indicator works perfectly fine on a chart, however on a watchlist column, it isn't displaying correctly - - I am interested in whether the most recent signal during the trading day was a buy or a sell... But this is only telling me if the current candle is a buy or sell which is not what I want... I hope this makes sense.

def na = double.nan;
input lookback = 21;

def lowBar = low == Lowest(low, lookback);
def HOLP = if lowBar then high else HOLP[1];
def closedAboveHOLP = if lowBar then 0 else if close > HOLP then closedAboveHOLP[1]+1 else closedAboveHOLP[1];
def buy = closedAboveHOLP == 1 and closedAboveHOLP[1] == 0;

def highBar = high == Highest(high, lookback);
def LOHP = if highBar then low else LOHP[1];
def closedBelowLOHP = if highBar then 0 else if close < LOHP then closedBelowLOHP[1]+1 else closedBelowLOHP[1];
def sell = closedBelowLOHP == 1 and closedBelowLOHP[1] == 0;

#plot output = if buy then 1 else if sell then -1 else 0;
#plot output = if buy then high else if sell then low else MidBodyVal()[6];
#plot output = if buy then high else if sell then low else na;

def fac1 = 0.003;
plot output =
       if buy[-1] then low*(1-fac1)
  else if buy then low[1]*(1-fac1)
  else if sell[-1] then high*(1+fac1)
  else if sell then high[1]*(1+fac1)
  else na;

output.assignvaluecolor(if buy then color.cyan else if sell then color.yellow else color.gray);
#output.assignvaluecolor(if buy then color.dark_green else if sell then color.dark_red else color.yellow);
output.setlineweight(3);

#assignbackgroundcolor(if buy then color.dark_green else if sell then color.dark_red else color.yellow);
#


lower
Code:
# hol_loh_carter_lower_0b

# test, lower
# col from upper

#https://usethinkscript.com/threads/mastering-the-trade.12180/
#Mastering The Trade
# AstroBoy  Start dateToday at 6:08 PM

#@halcyonguy Hey I was wondering if you can help me with this Watchlist Column indicator I am working on?
#Taking a page from John Carter's book Mastering the Trade, this indicator seeks to look back at the previous 21 candles on any time frame to see what is the "Highest of the Low Period (HOLP)" and what is the "Lowest of the High Period (LOHP)"...... If the price closed below HOLP, it signals a sell, and vice-versa if price closes above LOHP it signals a buy...
#This indicator works perfectly fine on a chart, however on a watchlist column, it isn't displaying correctly - - I am interested in whether the most recent signal during the trading day was a buy or a sell... But this is only telling me if the current candle is a buy or sell which is not what I want... I hope this makes sense.

declare lower;

def bn = barnumber();
def na = double.nan;

input lookback = 21;

def lowBar = low == Lowest(low, lookback);
def HOLP = if lowBar then high else HOLP[1];
def closedAboveHOLP = if lowBar then 0 else if close > HOLP then closedAboveHOLP[1]+1 else closedAboveHOLP[1];
def buy = closedAboveHOLP == 1 and closedAboveHOLP[1] == 0;

def highBar = high == Highest(high, lookback);
def LOHP = if highBar then low else LOHP[1];
def closedBelowLOHP = if highBar then 0 else if close < LOHP then closedBelowLOHP[1]+1 else closedBelowLOHP[1];
def sell = closedBelowLOHP == 1 and closedBelowLOHP[1] == 0;

plot output = if buy then 1 else if sell then -1 else 0;
output.assignvaluecolor(if buy then color.dark_green else if sell then color.dark_red else color.yellow);

#assignbackgroundcolor(if buy then color.dark_green else if sell then color.dark_red else color.yellow);


def out2 =
     if bn == 1 then 0
else if buy then 1
else if sell then -1
else if out2[1] > 0 then out2[1] + 1
else if out2[1] < 0 then out2[1] - 1
else 0;

addlabel(1, out2, (if out2 < 0 then color.red else if out2 > 0 then color.green else color.gray));
#
 
Solution
Dear ThinkScript community,
I am new with ThinkScript, I need your help.
I have modified the Thinkscript developped by @halcyonguy in order to plot an arrow on the chart when a buy signal or a sell signal is triggered. The code is given below, it works very well:

Code:
declare upper;

#INPUTS
input PriceChannel_Period = 21; #Length for the Price Chanbbel calculation
input Long_Short_SignalSize = 2; # Size of the Sell and Buy arrows
input Stop_SignalSize = 1; # Size of the arrows for stops
input Plot_Price_Chanel = yes; #plots the Price Channel
input Show_Stop_Signals = yes; #plots the stop signals

#Price Channel calculation
def LowerBand_PC = Lowest(low[1], PriceChannel_Period);
def UpperBand_PC = Highest(high[1], PriceChannel_Period);

#Price Channel High Breakout - Sell Signal

def highBar = high >= UpperBand_PC;

def LOHB = if highBar then low else LOHB[1];
def closedBelowLOHB = if highBar then 0 else if close < LOHB then closedBelowLOHB[1] + 1 else closedBelowLOHB[1];

def SellSignal = closedBelowLOHB == 1 and closedBelowLOHB[1] == 0;

#Price Channel Low Breakout - Buy Signal
def lowBar = low <= LowerBand_PC;

def HOLB = if lowBar then high else HOLB[1];
def closedAboveHOLB = if lowBar then 0 else if close > HOLB then closedAboveHOLB[1] + 1 else closedAboveHOLB[1];

def BuySignal = closedAboveHOLB == 1 and closedAboveHOLB[1] == 0;

#Short arrow signal - HOLB_LOHB Breakout
plot SellArrow = if SellSignal then high + 2 * TickSize() else Double.NaN;

SellArrow.SetPaintingStrategy(PaintingStrategy.ARROW_DOWN);
SellArrow.SetDefaultColor(Color.RED);
SellArrow.SetLineWeight(Long_Short_SignalSize);

#Long arrow signal - HOLB_LOHB Breakout
plot BuyArrow = if BuySignal then low - 2 * TickSize() else Double.NaN;

BuyArrow.SetPaintingStrategy(PaintingStrategy.ARROW_UP);
BuyArrow.SetDefaultColor(Color.GREEN);
BuyArrow.SetLineWeight(Long_Short_SignalSize);

#Plots Price Channel bands
plot PriceChannelUpperBand = if Plot_Price_Chanel then UpperBand_PC else Double.NaN;

PriceChannelUpperBand.SetPaintingStrategy(PaintingStrategy.LINE);
PriceChannelUpperBand.SetDefaultColor(Color.DARK_RED);
PriceChannelUpperBand.SetLineWeight(Long_Short_SignalSize);
PriceChannelUpperBand.SetStyle(Curve.FIRM);

plot PriceChannelLowerBand = if Plot_Price_Chanel then LowerBand_PC else Double.NaN;

PriceChannelLowerBand.SetPaintingStrategy(PaintingStrategy.LINE);
PriceChannelLowerBand.SetDefaultColor(Color.DARK_GREEN);
PriceChannelLowerBand.SetLineWeight(Long_Short_SignalSize);
PriceChannelLowerBand.SetStyle(Curve.FIRM);

# END

I would like to add an arrow when a stopsellsignal or a stopbuysignal id triggered.
The stopsellsignal is defined as follows:
- if a sell signal is in progress, stopsellsignal is trigerred either if low <= LowerBand_PC or if close >= high[2]. In that case an arrow up is plotted at the low of the current candle. Only the first arrow is plotted based on the first stop signal triggered.
The stopbuysignal is defined as follows:
- if a buy signal is in progress, stopbuysignal is trigerred either if high >= UpperBand_PC or if close <= low[2]. In that case an arrow down is plotted at the high of the current candle. Only the first arrow is plotted based on the first stop signal triggered.

In the attached chart, the green and red arrows are buy and sell signals. This is ok, it works well.
The dark green and dark red arrows are the stopsellsignal and the stopbuysignal. This is my problem, I would like some help to modified my script in order to plot theses stop arrows.

Many thanks in advance for your help.
Bruno
 

Attachments

  • Chart.png
    Chart.png
    41.6 KB · Views: 14
Last edited:

Join useThinkScript to post your question to a community of 21,000+ developers and traders.

Similar threads

Not the exact question you're looking for?

Start a new thread and receive assistance from our community.

87k+ Posts
450 Online
Create Post

Similar threads

Similar threads

The Market Trading Game Changer

Join 2,500+ subscribers inside the useThinkScript VIP Membership Club
  • Exclusive indicators
  • Proven strategies & setups
  • Private Discord community
  • ‘Buy The Dip’ signal alerts
  • Exclusive members-only content
  • Add-ons and resources
  • 1 full year of unlimited support

Frequently Asked Questions

What is useThinkScript?

useThinkScript is the #1 community of stock market investors using indicators and other tools to power their trading strategies. Traders of all skill levels use our forums to learn about scripting and indicators, help each other, and discover new ways to gain an edge in the markets.

How do I get started?

We get it. Our forum can be intimidating, if not overwhelming. With thousands of topics, tens of thousands of posts, our community has created an incredibly deep knowledge base for stock traders. No one can ever exhaust every resource provided on our site.

If you are new, or just looking for guidance, here are some helpful links to get you started.

What are the benefits of VIP Membership?
VIP members get exclusive access to these proven and tested premium indicators: Buy the Dip, Advanced Market Moves 2.0, Take Profit, and Volatility Trading Range. In addition, VIP members get access to over 50 VIP-only custom indicators, add-ons, and strategies, private VIP-only forums, private Discord channel to discuss trades and strategies in real-time, customer support, trade alerts, and much more. Learn all about VIP membership here.
How can I access the premium indicators?
To access the premium indicators, which are plug and play ready, sign up for VIP membership here.
Back
Top