AstroBoy
New member
@halcyonguy Hey I was wondering if you can help me with this Watchlist Column indicator I am working on?
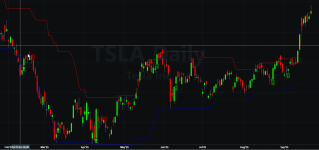
Taking a page from John Carter's book Mastering the Trade, this indicator seeks to look back at the previous 21 candles on any time frame to see what is the "Highest of the Low Period (HOLP)" and what is the "Lowest of the High Period (LOHP)"...... If the price closed below HOLP, it signals a sell, and vice-versa if price closes above LOHP it signals a buy...
This indicator works perfectly fine on a chart, however on a watchlist column, it isn't displaying correctly - - I am interested in whether the most recent signal during the trading day was a buy or a sell... But this is only telling me if the current candle is a buy or sell which is not what I want... I hope this makes sense.
Code:
input lookback = 21;

def lowBar = low == Lowest(low, lookback);
def HOLP = if lowBar then high else HOLP[1];
def closedAboveHOLP = if lowBar then 0 else if close > HOLP then closedAboveHOLP[1]+1 else closedAboveHOLP[1];
def buy = closedAboveHOLP == 1 and closedAboveHOLP[1] == 0;

def highBar = high == Highest(high, lookback);
def LOHP = if highBar then low else LOHP[1];
def closedBelowLOHP = if highBar then 0 else if close < LOHP then closedBelowLOHP[1]+1 else closedBelowLOHP[1];
def sell = closedBelowLOHP == 1 and closedBelowLOHP[1] == 0;

plot output = if buy then 1 else if sell then -1 else 0;
output.assignvaluecolor(if buy then color.dark_green else if sell then color.dark_red else color.yellow);
assignbackgroundcolor(if buy then color.dark_green else if sell then color.dark_red else color.yellow);
Last edited by a moderator: