
hectorgasm
Member
just tried this but it doesn't seem to work on 1h or 1 minute charts :-(
Perhaps a screenshot of what you are doing would help. This works for me on all timeframes with/without extended hours on.just tried this but it doesn't seem to work on 1h or 1 minute charts :-(
Magic Fibonacci 1.272 ScannerI love this indicator. I am trying to setup scan with the below criteria, I am not getting any results. can anyone help me on this?
close crosses above shared_kg_Magic_Fibonacci()."fib" within 3 bars
# Magic Fibonacci 1.272
# Author: Kory Gill, @korygill
declare once_per_bar;

def vClose = close;
def nan = Double.NaN;

def showPrevClose = 0;
def showOpen = 0;

# logic
def isRollover = GetYYYYMMDD() != GetYYYYMMDD()[1];
def beforeStart = GetTime() < RegularTradingStart(GetYYYYMMDD());
def afterEnd = GetTime() > RegularTradingEnd(GetYYYYMMDD());
def firstBarOfDay = if (beforeStart[1] == 1 and beforeStart == 0) or (isRollover and beforeStart == 0) then 1 else 0;
def lastBarOfDay = if
    (afterEnd[-1] == 1 and afterEnd == 0) or
    (isRollOver[-1] and firstBarOfDay[-1])
    then 1
    else 0;

def dayOpen = if firstBarOfDay then vClose else dayOpen[1];
def prevDayClose = if lastBarOfDay then vClose else prevDayClose[1];

# fibs
def delta = if firstBarOfDay then dayOpen - prevDayClose else delta[1];
def fib1272 = if firstBarOfDay then prevDayClose + delta * 1.272 else fib1272[1];
def fib = if firstBarOfDay[-1] then nan else fib1272;

plot scan = !isnan(fib) and (close crosses above fib within 3 bars) ;Thank you so much. It is working as expected.Magic Fibonacci 1.272 Scanner
Shared Scan Link: http://tos.mx/e8YnGnY Click here for --> Easiest way to load shared links
FYI, this script references future bars. So the scan results will always lag at least one bar.

This is only a scanner script will not plot on a chart.
Ruby:# Magic Fibonacci 1.272 # Author: Kory Gill, @korygill declare once_per_bar; def vClose = close; def nan = Double.NaN; def showPrevClose = 0; def showOpen = 0; # logic def isRollover = GetYYYYMMDD() != GetYYYYMMDD()[1]; def beforeStart = GetTime() < RegularTradingStart(GetYYYYMMDD()); def afterEnd = GetTime() > RegularTradingEnd(GetYYYYMMDD()); def firstBarOfDay = if (beforeStart[1] == 1 and beforeStart == 0) or (isRollover and beforeStart == 0) then 1 else 0; def lastBarOfDay = if (afterEnd[-1] == 1 and afterEnd == 0) or (isRollOver[-1] and firstBarOfDay[-1]) then 1 else 0; def dayOpen = if firstBarOfDay then vClose else dayOpen[1]; def prevDayClose = if lastBarOfDay then vClose else prevDayClose[1]; # fibs def delta = if firstBarOfDay then dayOpen - prevDayClose else delta[1]; def fib1272 = if firstBarOfDay then prevDayClose + delta * 1.272 else fib1272[1]; def fib = if firstBarOfDay[-1] then nan else fib1272; plot scan = !isnan(fib) and (close crosses above fib within 3 bars) ;
I have re-worked the code for Magic Fibonacci 1.272 in this post. Please see that post for more background on this indicator, and its origination.
This update, version 2.0, has new logic to allow the indicator to show when the Extended session is visible and when the Extended session is not visible.
Sidebar: it took me a few iterations and some debugging to find the right conditions, and work around a few bugs/nuances in thinkscript around time. I will post another thread on that soon.
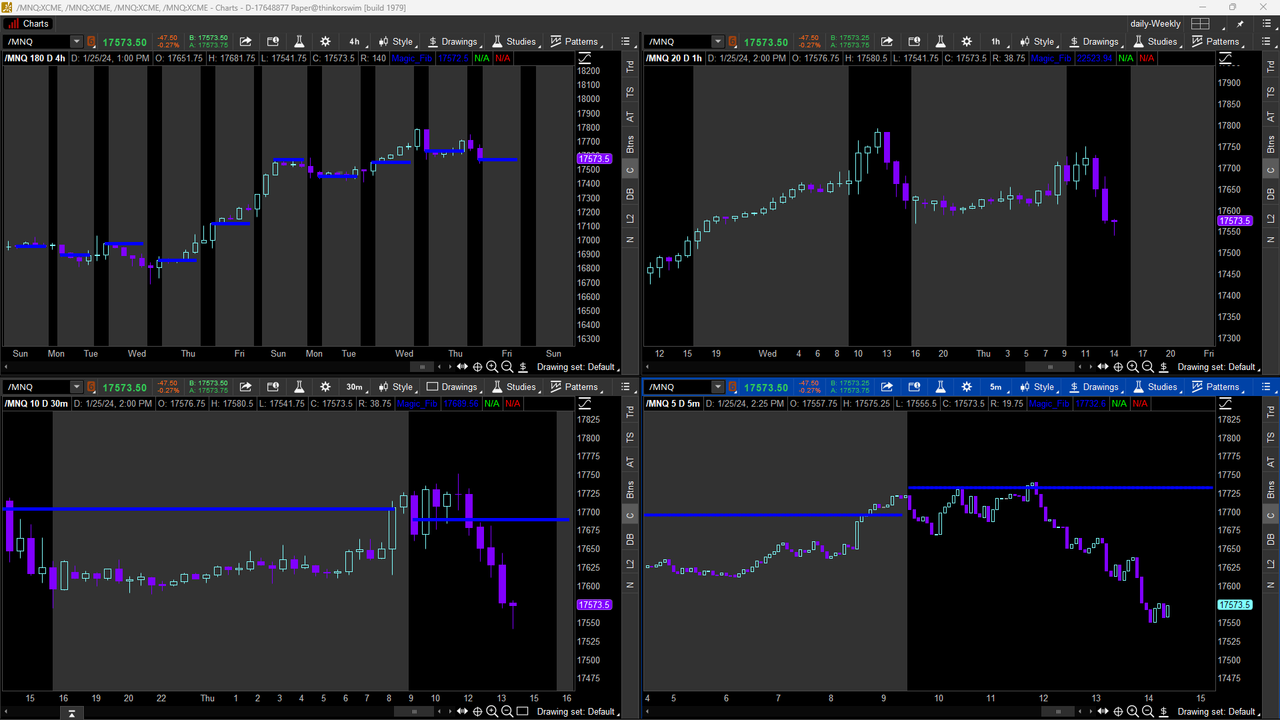
Here is an example of a flex grid with Extended hours visible and not visible. Notice the Magic Fibonacci 1.272 Indicators displays as expected on both charts.
Magic Fibonacci 1.272

Link to Flex Grid
https://tos.mx/nVqihA
Source Code for Magic Fibonacci 1.272
Code:# Magic Fibonacci 1.272 # Author: Kory Gill, @korygill # Gap feature modfied by WalkingBallista # # VERSION HISTORY (sortable date and time (your local time is fine), and your initials # 20190823-1300-KG - fixed logic to find first bar of trading day # so study works with extended sessions showing/not showing. # Removed logic around gapUp/gapDown. # ... # ... declare upper; declare hide_on_daily; declare once_per_bar; def vClose = close; def nan = Double.NaN; # debug and extra indicator flags # could make input variables, but that makes # the study name longer, and most people # probably want these off by default def showPrevClose = 0; def showOpen = 0; # logic def isRollover = GetYYYYMMDD() != GetYYYYMMDD()[1]; def beforeStart = GetTime() < RegularTradingStart(GetYYYYMMDD()); def afterEnd = GetTime() > RegularTradingEnd(GetYYYYMMDD()); def firstBarOfDay = if (beforeStart[1] == 1 and beforeStart == 0) or (isRollover and beforeStart == 0) then 1 else 0; def lastBarOfDay = if (afterEnd[-1] == 1 and afterEnd == 0) or (isRollOver[-1] and firstBarOfDay[-1]) then 1 else 0; def dayOpen = if firstBarOfDay then vClose else dayOpen[1]; def prevDayClose = if lastBarOfDay then vClose else prevDayClose[1]; # fibs def delta = if firstBarOfDay then dayOpen - prevDayClose else delta[1]; def fib1272 = if firstBarOfDay then prevDayClose + delta * 1.272 else fib1272[1]; # colors, see https://usethinkscript.com/threads/rainbow-indicators-%E2%80%93-bb-and-moving-average.294/ # # plots # Plot nan on the bar before a new plot starts on firstBarOfDay. # This causes the plot to draw without an annoying connecting line from # one day to the next. # plot fib = if firstBarOfDay[-1] then nan else fib1272; fib.SetDefaultColor(CreateColor(0,0,255)); plot pOpen = if showOpen and !firstBarOfDay[-1] then dayOpen else nan; plot pPrevClose = if showPrevClose and !lastBarOfDay[-1] then prevDayClose else nan; pOpen.SetDefaultColor(CreateColor(0,255,0)); pPrevClose.SetDefaultColor(CreateColor(255,0,0));
Disclaimers and Notices
You are free to use this code for personal use, and make derivative works from it. You are not granted permission to use this code (or derivative works) for commercial purposes which includes and is not limited to selling, reselling, or packaging with other commercial indicators. Headers and attribution in this code should remain as provided, and any derivative works should extend the existing headers.
How are you using this Magic fib in your trading? Are you using it as the day goes on or in the moring?I have re-worked the code for Magic Fibonacci 1.272 in this post. Please see that post for more background on this indicator, and its origination.
This update, version 2.0, has new logic to allow the indicator to show when the Extended session is visible and when the Extended session is not visible.
Sidebar: it took me a few iterations and some debugging to find the right conditions, and work around a few bugs/nuances in thinkscript around time. I will post another thread on that soon.
Here is an example of a flex grid with Extended hours visible and not visible. Notice the Magic Fibonacci 1.272 Indicators displays as expected on both charts.
Magic Fibonacci 1.272

Link to Flex Grid
https://tos.mx/nVqihA
Source Code for Magic Fibonacci 1.272
Code:# Magic Fibonacci 1.272 # Author: Kory Gill, @korygill # Gap feature modfied by WalkingBallista # # VERSION HISTORY (sortable date and time (your local time is fine), and your initials # 20190823-1300-KG - fixed logic to find first bar of trading day # so study works with extended sessions showing/not showing. # Removed logic around gapUp/gapDown. # ... # ... declare upper; declare hide_on_daily; declare once_per_bar; def vClose = close; def nan = Double.NaN; # debug and extra indicator flags # could make input variables, but that makes # the study name longer, and most people # probably want these off by default def showPrevClose = 0; def showOpen = 0; # logic def isRollover = GetYYYYMMDD() != GetYYYYMMDD()[1]; def beforeStart = GetTime() < RegularTradingStart(GetYYYYMMDD()); def afterEnd = GetTime() > RegularTradingEnd(GetYYYYMMDD()); def firstBarOfDay = if (beforeStart[1] == 1 and beforeStart == 0) or (isRollover and beforeStart == 0) then 1 else 0; def lastBarOfDay = if (afterEnd[-1] == 1 and afterEnd == 0) or (isRollOver[-1] and firstBarOfDay[-1]) then 1 else 0; def dayOpen = if firstBarOfDay then vClose else dayOpen[1]; def prevDayClose = if lastBarOfDay then vClose else prevDayClose[1]; # fibs def delta = if firstBarOfDay then dayOpen - prevDayClose else delta[1]; def fib1272 = if firstBarOfDay then prevDayClose + delta * 1.272 else fib1272[1]; # colors, see https://usethinkscript.com/threads/rainbow-indicators-%E2%80%93-bb-and-moving-average.294/ # # plots # Plot nan on the bar before a new plot starts on firstBarOfDay. # This causes the plot to draw without an annoying connecting line from # one day to the next. # plot fib = if firstBarOfDay[-1] then nan else fib1272; fib.SetDefaultColor(CreateColor(0,0,255)); plot pOpen = if showOpen and !firstBarOfDay[-1] then dayOpen else nan; plot pPrevClose = if showPrevClose and !lastBarOfDay[-1] then prevDayClose else nan; pOpen.SetDefaultColor(CreateColor(0,255,0)); pPrevClose.SetDefaultColor(CreateColor(255,0,0));
Disclaimers and Notices
You are free to use this code for personal use, and make derivative works from it. You are not granted permission to use this code (or derivative works) for commercial purposes which includes and is not limited to selling, reselling, or packaging with other commercial indicators. Headers and attribution in this code should remain as provided, and any derivative works should extend the existing headers.
@Duction - Here is a script that covers all the common fibs along with a special one I picked up from someone. Enjoy. (Apologies for the delay - I was just searching for the 1.272 script and noticed your comment...thought I'd pitch this in if you're interested...)korygill, is there a way to edit the script to include additional fib levels? 1.618? Thank you.
input ShowLevelLabels = yes;
input lookback = 1;
input Timeframe = AggregationPeriod.DAY;

def Prange = high(period = Timeframe)[lookback] - low(period = Timeframe)[lookback];
def FibExt1 = 1.382;
def FibExt2 = 1.618;
def Two36 = .236;
def Three82 = .382;
def Six18 = .618;
def Seven86 = .786;
def PeteLevel = .886;

def yhigh = high(period = Timeframe)[1];

plot fib_ext_down2 = yhigh - (Prange * FibExt2);
fib_ext_down2.SetDefaultColor(Color.GREEN);
fib_ext_down2.SetStyle(Curve.FIRM);
fib_ext_down2.SetPaintingStrategy(PaintingStrategy.HORIZONTAL);
    #fib_ext_down2.HideTitle();

plot fib_ext_down1 = yhigh - (Prange * FibExt1);
fib_ext_down1.SetDefaultColor(Color.YELLOW);
fib_ext_down1.SetStyle(Curve.FIRM);
fib_ext_down1.SetPaintingStrategy(PaintingStrategy.HORIZONTAL);
#fib_ext_down1.HideTitle();

plot plow = low(period = Timeframe)[lookback];
plow.SetDefaultColor(Color.GREEN);
plow.SetStyle(Curve.SHORT_DASH);
plow.SetLineWeight(2);
plow.SetPaintingStrategy(PaintingStrategy.HORIZONTAL);
    #plow.HideTitle();

plot LOPeteLine = yhigh - (Prange * PeteLevel);
LOPeteLine.SetDefaultColor(Color.CYAN);
LOPeteLine.SetStyle(Curve.FIRM);
LOPeteLine.SetPaintingStrategy(PaintingStrategy.HORIZONTAL);

plot twentythreesix = plow + (prange * two36);
twentythreesix.setdefaultcolor(color.yellow);
twentythreesix.setstyle(curve.firm);
twentythreesix.setpaintingstrategy(paintingstrategy.horizontal);


plot ThirtyEightTwo = plow + (Prange * Three82);
ThirtyEightTwo.SetDefaultColor(Color.MAGENTA);
ThirtyEightTwo.SetStyle(Curve.FIRM);
ThirtyEightTwo.SetPaintingStrategy(PaintingStrategy.HORIZONTAL);
    #ThirtyEightTwo.HideTitle();

plot fib_mid = (yhigh + plow) / 2;
fib_mid.SetDefaultColor(CreateColor(255, 140, 0));
fib_mid.SetPaintingStrategy(PaintingStrategy.HORIZONTAL);
    #fib_mid.setdefaultcolor(color.gray);
fib_mid.SetStyle(Curve.FIRM);
fib_mid.SetPaintingStrategy(PaintingStrategy.HORIZONTAL);
    #fib_mid.hidetitle();

plot sixtyoneeight = plow + (Prange * Six18);
sixtyoneeight.SetDefaultColor(Color.MAGENTA);
sixtyoneeight.SetStyle(Curve.FIRM);
sixtyoneeight.SetPaintingStrategy(PaintingStrategy.HORIZONTAL);
    #sixtyoneeight.HideTitle();

plot SevenEightSix = plow + (prange * seven86);
SevenEightSix.setdefaultcolor(color.yellow);
SevenEightSix.setstyle(curve.firm);
SevenEightSix.SetPaintingStrategy(PaintingStrategy.HORIZONTAL);

plot HIPeteLine = plow + (Prange * PeteLevel);
HIPeteLine.SetDefaultColor(Color.CYAN);
HIPeteLine.SetStyle(Curve.FIRM);
HIPeteLine.SetPaintingStrategy(PaintingStrategy.HORIZONTAL);

plot phigh = yhigh;
phigh.SetDefaultColor(Color.RED);
phigh.SetStyle(Curve.SHORT_DASH);
phigh.SetLineWeight(2);
phigh.SetPaintingStrategy(PaintingStrategy.HORIZONTAL);
    #phigh.HideTitle();

plot fib_ext_up1 = plow + (Prange * FibExt1);
fib_ext_up1.SetDefaultColor(Color.YELLOW);
fib_ext_up1.SetStyle(Curve.FIRM);
fib_ext_up1.SetPaintingStrategy(PaintingStrategy.HORIZONTAL);
    #fib_ext_up1.HideTitle();

plot fib_ext_up2 = plow + (Prange * FibExt2);
fib_ext_up2.SetDefaultColor(Color.RED);
fib_ext_up2.SetStyle(Curve.FIRM);
fib_ext_up2.SetPaintingStrategy(PaintingStrategy.HORIZONTAL);
    #fib_ext_up2.HideTitle();


AddLabel(ShowLevelLabels, "LOW 1.618: " + fib_ext_down2, fib_ext_down2.TakeValueColor());
AddLabel(ShowLevelLabels, "LOW 1.382: " + fib_ext_down1, fib_ext_down1.TakeValueColor());
AddLabel(ShowLevelLabels, "Prv Low: " + plow, plow.TakeValueColor());
AddLabel(ShowLevelLabels, "Pete 11.4: " + LOPeteLine, LOPeteLine.TakeValueColor());
AddLabel(ShowLevelLabels, "23.6% " + TwentyThreeSix,TwentyThreeSix.TakeValueColor());
AddLabel(ShowLevelLabels, "38.2% " + ThirtyEightTwo, ThirtyEightTwo.TakeValueColor());
AddLabel(ShowLevelLabels, "50% " + fib_mid, fib_mid.TakeValueColor());
AddLabel(ShowLevelLabels, "61.8% " + sixtyoneeight, sixtyoneeight.TakeValueColor());
AddLabel(ShowLevelLabels, "78.6% " + SevenEightSix, SevenEightSix.TakeValueColor());
AddLabel(ShowLevelLabels, "Pete 88.6: " + HIPeteLine, HIPeteLine.TakeValueColor());
AddLabel(ShowLevelLabels, "Prv High: " + phigh, phigh.TakeValueColor());
AddLabel(ShowLevelLabels, "HIGH 1.382: " + fib_ext_up1, fib_ext_up1.TakeValueColor());
AddLabel(ShowLevelLabels, "HIGH 1.618: " + fib_ext_up2, fib_ext_up2.TakeValueColor());I am loving this script and watching it to get to know it. CAn you tell me the meaning of Petehi and Petelow? I see they are .87 and .11 but can you share how you use this indicator a little please?@Duction - Here is a script that covers all the common fibs along with a special one I picked up from someone. Enjoy. (Apologies for the delay - I was just searching for the 1.272 script and noticed your comment...thought I'd pitch this in if you're interested...)
You can select the timeframe on this as well.
Code:input ShowLevelLabels = yes; input lookback = 1; input Timeframe = AggregationPeriod.DAY; def Prange = high(period = Timeframe)[lookback] - low(period = Timeframe)[lookback]; def FibExt1 = 1.382; def FibExt2 = 1.618; def Two36 = .236; def Three82 = .382; def Six18 = .618; def Seven86 = .786; def PeteLevel = .886; def yhigh = high(period = Timeframe)[1]; plot fib_ext_down2 = yhigh - (Prange * FibExt2); fib_ext_down2.SetDefaultColor(Color.GREEN); fib_ext_down2.SetStyle(Curve.FIRM); fib_ext_down2.SetPaintingStrategy(PaintingStrategy.HORIZONTAL); #fib_ext_down2.HideTitle(); plot fib_ext_down1 = yhigh - (Prange * FibExt1); fib_ext_down1.SetDefaultColor(Color.YELLOW); fib_ext_down1.SetStyle(Curve.FIRM); fib_ext_down1.SetPaintingStrategy(PaintingStrategy.HORIZONTAL); #fib_ext_down1.HideTitle(); plot plow = low(period = Timeframe)[lookback]; plow.SetDefaultColor(Color.GREEN); plow.SetStyle(Curve.SHORT_DASH); plow.SetLineWeight(2); plow.SetPaintingStrategy(PaintingStrategy.HORIZONTAL); #plow.HideTitle(); plot LOPeteLine = yhigh - (Prange * PeteLevel); LOPeteLine.SetDefaultColor(Color.CYAN); LOPeteLine.SetStyle(Curve.FIRM); LOPeteLine.SetPaintingStrategy(PaintingStrategy.HORIZONTAL); plot twentythreesix = plow + (prange * two36); twentythreesix.setdefaultcolor(color.yellow); twentythreesix.setstyle(curve.firm); twentythreesix.setpaintingstrategy(paintingstrategy.horizontal); plot ThirtyEightTwo = plow + (Prange * Three82); ThirtyEightTwo.SetDefaultColor(Color.MAGENTA); ThirtyEightTwo.SetStyle(Curve.FIRM); ThirtyEightTwo.SetPaintingStrategy(PaintingStrategy.HORIZONTAL); #ThirtyEightTwo.HideTitle(); plot fib_mid = (yhigh + plow) / 2; fib_mid.SetDefaultColor(CreateColor(255, 140, 0)); fib_mid.SetPaintingStrategy(PaintingStrategy.HORIZONTAL); #fib_mid.setdefaultcolor(color.gray); fib_mid.SetStyle(Curve.FIRM); fib_mid.SetPaintingStrategy(PaintingStrategy.HORIZONTAL); #fib_mid.hidetitle(); plot sixtyoneeight = plow + (Prange * Six18); sixtyoneeight.SetDefaultColor(Color.MAGENTA); sixtyoneeight.SetStyle(Curve.FIRM); sixtyoneeight.SetPaintingStrategy(PaintingStrategy.HORIZONTAL); #sixtyoneeight.HideTitle(); plot SevenEightSix = plow + (prange * seven86); SevenEightSix.setdefaultcolor(color.yellow); SevenEightSix.setstyle(curve.firm); SevenEightSix.SetPaintingStrategy(PaintingStrategy.HORIZONTAL); plot HIPeteLine = plow + (Prange * PeteLevel); HIPeteLine.SetDefaultColor(Color.CYAN); HIPeteLine.SetStyle(Curve.FIRM); HIPeteLine.SetPaintingStrategy(PaintingStrategy.HORIZONTAL); plot phigh = yhigh; phigh.SetDefaultColor(Color.RED); phigh.SetStyle(Curve.SHORT_DASH); phigh.SetLineWeight(2); phigh.SetPaintingStrategy(PaintingStrategy.HORIZONTAL); #phigh.HideTitle(); plot fib_ext_up1 = plow + (Prange * FibExt1); fib_ext_up1.SetDefaultColor(Color.YELLOW); fib_ext_up1.SetStyle(Curve.FIRM); fib_ext_up1.SetPaintingStrategy(PaintingStrategy.HORIZONTAL); #fib_ext_up1.HideTitle(); plot fib_ext_up2 = plow + (Prange * FibExt2); fib_ext_up2.SetDefaultColor(Color.RED); fib_ext_up2.SetStyle(Curve.FIRM); fib_ext_up2.SetPaintingStrategy(PaintingStrategy.HORIZONTAL); #fib_ext_up2.HideTitle(); AddLabel(ShowLevelLabels, "LOW 1.618: " + fib_ext_down2, fib_ext_down2.TakeValueColor()); AddLabel(ShowLevelLabels, "LOW 1.382: " + fib_ext_down1, fib_ext_down1.TakeValueColor()); AddLabel(ShowLevelLabels, "Prv Low: " + plow, plow.TakeValueColor()); AddLabel(ShowLevelLabels, "Pete 11.4: " + LOPeteLine, LOPeteLine.TakeValueColor()); AddLabel(ShowLevelLabels, "23.6% " + TwentyThreeSix,TwentyThreeSix.TakeValueColor()); AddLabel(ShowLevelLabels, "38.2% " + ThirtyEightTwo, ThirtyEightTwo.TakeValueColor()); AddLabel(ShowLevelLabels, "50% " + fib_mid, fib_mid.TakeValueColor()); AddLabel(ShowLevelLabels, "61.8% " + sixtyoneeight, sixtyoneeight.TakeValueColor()); AddLabel(ShowLevelLabels, "78.6% " + SevenEightSix, SevenEightSix.TakeValueColor()); AddLabel(ShowLevelLabels, "Pete 88.6: " + HIPeteLine, HIPeteLine.TakeValueColor()); AddLabel(ShowLevelLabels, "Prv High: " + phigh, phigh.TakeValueColor()); AddLabel(ShowLevelLabels, "HIGH 1.382: " + fib_ext_up1, fib_ext_up1.TakeValueColor()); AddLabel(ShowLevelLabels, "HIGH 1.618: " + fib_ext_up2, fib_ext_up2.TakeValueColor());
I am loving this script and watching it to get to know it. CAn you tell me the meaning of Petehi and Petelow? I see they are .87 and .11 but can you share how you use this indicator a little please?
# Auto Fib Levels based on Previous days range.

def Timeframe = AggregationPeriod.DAY;

def ShowTodayOnly = Yes;
def s=ShowTodayOnly;
def today=if s==0 OR getday()==getlastday() then 1 else 0;

def lookback = 1;

def Prange = high(period = Timeframe)[lookback] - low(period = Timeframe)[lookback];

def FibExt1 = 1.382;
def FibExt2 = 1.618;
def Two36 = .236;
def Three82 = .382;
def Six18 = .618;
def Seven86 = .786;
def PeteLevel = .886;

def yhigh = high(period = Timeframe)[1];

def c = close(period=timeframe);

def starttime = 1455;
def endtime = 1456;

def showBubble = if secondstilltime(endtime) > 0 and secondsfromtime(starttime)>=0 then 1 else 0;

plot fib_ext_down2 = if today == 1 then yhigh - (Prange * FibExt2) else double.nan;
fib_ext_down2.SetDefaultColor(Color.GREEN);
fib_ext_down2.SetStyle(Curve.FIRM);
fib_ext_down2.SetPaintingStrategy(PaintingStrategy.HORIZONTAL);
AddChartBubble(showBubble == 1 and fib_ext_down2,fib_ext_down2,fib_ext_down2,fib_ext_down2.takevaluecolor(),no);

plot fib_ext_down1 = if today == 1 then yhigh - (Prange * FibExt1) else double.nan;
fib_ext_down1.SetDefaultColor(Color.YELLOW);
fib_ext_down1.SetStyle(Curve.FIRM);
fib_ext_down1.SetPaintingStrategy(PaintingStrategy.HORIZONTAL);
AddChartBubble(showbubble == 1 and fib_ext_down1,fib_ext_down1,fib_ext_down1,fib_ext_down1.takevaluecolor(),no);

plot plow = if today == 1 then low(period = Timeframe)[lookback] else double.nan;
plow.SetDefaultColor(Color.GREEN);
plow.SetStyle(Curve.SHORT_DASH);
plow.SetLineWeight(2);
plow.SetPaintingStrategy(PaintingStrategy.HORIZONTAL);
AddChartBubble(showbubble == 1 and plow,plow,plow,plow.takevaluecolor(),no);

plot LOPeteLine = if today == 1 then yhigh - (Prange * PeteLevel) else double.nan;
LOPeteLine.SetDefaultColor(Color.CYAN);
LOPeteLine.SetStyle(Curve.FIRM);
LOPeteLine.SetPaintingStrategy(PaintingStrategy.HORIZONTAL);
AddChartBubble(showbubble == 1 and LOPeteLine,LOPeteLine,LOPeteLine,LOPeteLine.takevaluecolor(),no);

plot ThirtyEightTwo = if today == 1 then plow + (Prange * Three82) else double.nan;
ThirtyEightTwo.SetDefaultColor(Color.MAGENTA);
ThirtyEightTwo.SetStyle(Curve.FIRM);
ThirtyEightTwo.SetPaintingStrategy(PaintingStrategy.HORIZONTAL);
AddChartBubble(showbubble == 1 and ThirtyEightTwo,ThirtyEightTwo,ThirtyEightTwo,ThirtyEightTwo.takevaluecolor(),no);

plot fib_mid = if today == 1 then (yhigh + plow) / 2 else double.nan;
fib_mid.SetDefaultColor(CreateColor(255, 140, 0));
fib_mid.SetPaintingStrategy(PaintingStrategy.HORIZONTAL);
fib_mid.SetStyle(Curve.FIRM);
fib_mid.SetPaintingStrategy(PaintingStrategy.HORIZONTAL);
AddChartBubble(showbubble == 1 and fib_mid,fib_mid,fib_mid,fib_mid.takevaluecolor(),no);

plot sixtyoneeight = if today == 1 then plow + (Prange * Six18) else double.nan;
sixtyoneeight.SetDefaultColor(Color.MAGENTA);
sixtyoneeight.SetStyle(Curve.FIRM);
sixtyoneeight.SetPaintingStrategy(PaintingStrategy.HORIZONTAL);
AddChartBubble(showbubble == 1 and sixtyoneeight,sixtyoneeight,sixtyoneeight,sixtyoneeight.takevaluecolor(),no);

plot HIPeteLine = if today == 1 then plow + (Prange * PeteLevel) else double.nan;
HIPeteLine.SetDefaultColor(Color.CYAN);
HIPeteLine.SetStyle(Curve.FIRM);
HIPeteLine.SetPaintingStrategy(PaintingStrategy.HORIZONTAL);
AddChartBubble(showbubble == 1 and HIPeteLine,HIPeteLine,HIPeteLine,HIPeteLine.takevaluecolor(),no);

plot phigh = if today == 1 then yhigh else double.nan;
phigh.SetDefaultColor(Color.RED);
phigh.SetStyle(Curve.SHORT_DASH);
phigh.SetLineWeight(2);
phigh.SetPaintingStrategy(PaintingStrategy.HORIZONTAL);
AddChartBubble(showbubble == 1 and phigh,phigh,phigh,phigh.takevaluecolor(),no);

plot fib_ext_up1 = if today == 1 then plow + (Prange * FibExt1) else double.nan;
fib_ext_up1.SetDefaultColor(Color.YELLOW);
fib_ext_up1.SetStyle(Curve.FIRM);
fib_ext_up1.SetPaintingStrategy(PaintingStrategy.HORIZONTAL);
AddChartBubble(showbubble == 1 and fib_ext_up1,fib_ext_up1,fib_ext_up1,fib_ext_up1.takevaluecolor(),no);

plot fib_ext_up2 = if today == 1 then plow + (Prange * FibExt2) else double.nan;
fib_ext_up2.SetDefaultColor(Color.RED);
fib_ext_up2.SetStyle(Curve.FIRM);
fib_ext_up2.SetPaintingStrategy(PaintingStrategy.HORIZONTAL);
AddChartBubble(showbubble == 1 and fib_Ext_up2,fib_Ext_up2,fib_Ext_up2,fib_Ext_up2.takevaluecolor(),no);

plot cl = if today == 1 then  (C) else double.nan;
cl.setpaintingstrategy(paintingstrategy.horizontal);
cl.setlineweight(3);that is exactly how i trade naturally!!! reversals on longer timelines in what i call pokey tickers (so mistakes are not brutal)!My apologies for not showing up very much @Juno (Best Day EVER) and @MerryDay.
I actually meant to rename those lines and forgot to. The guy who shared them with me is named Pete. I've noticed on SPY and SPX that they seem to be pretty responsive as daily support or resistance levels. Not every day, but there are certainly days they are legitimate. You may experience good results on individual names as well.
I personally trade more reversals than momentum, so, I actually watch for these lines exactly opposite to what MerryDay mentioned above. DO NOT take this statement as me claiming one way is better or more correct. That is not the intent at all! If they work for you, trade as you see fit.
Another way I've used this indicator is to put multiple instances on a daily chart shaded different colors for Daily, Weekly, and Monthly timeframes. You can do this and simply change the indicator settings per instance on a chart. I've used this setup a decent bit on longer swing trades with what I consider to be good success. These are typically trades at a fairly low volume so that when they do go against me the "mental pain" is as light as possible. I'll usually play an option intraday as a hedge in those instances.
And Yes, I do fully support MerryDay's advice on googling fib trading and will add, don't stop there. If you see a "hole", it may mean you see something a little different that you might be able to exploit for yourself. This is trading and the better you know what prompts you to engage with the market, the better trader you can become. IMHO - trading success is more about how well you know yourself than anything else. Sounds cliche I know, but, the further into it I get, the more real that idea becomes. As always your mileage may vary wildly!
(On a side note, I think my email provider was kicking notices from here into a spam folder, so, I've made some adjustments and hopefully will "see" alerts from here better....)
Nice Juno! When you have the three longer timeframes showing together, it's not unusual for levels from the 3 time frames to be close.that is exactly how i trade naturally!!! reversals on longer timelines in what i call pokey tickers (so mistakes are not brutal)!
I trade the gann levels similar to how you trade the pete line. And I do the same thing- put the person who gave me the tool- their first name into the title so i can track it! haha
I think you are saying map out on the daily weekly monthly with color coded and trade off those levels (I do that in TV using what they call "arrays" there- so this is natural for me. I love trading the golden pocket pullback off array edges on the 4h timeline in futures.
Thank you for the reply. I will reach out with any further questions and thank you again for the share.
,
For some reason I am not able to get this script to work on 1 hr time frame.
Each Grid was stripped down to just Magic Fib. I also loaded the 30-minute and 1-hour saved style and changed the TF to 1-Hour with no luck. I am using your 20230823 version (great way to sort BTW)
This is a nice script.
 Code:
Code:# Magic Fibonacci 1.272 # Author: Kory Gill, @korygill # Gap feature modfied by WalkingBallista # # VERSION HISTORY (sortable date and time (your local time is fine), and your initials # 20190823-1300-KG - fixed logic to find first bar of trading day # so study works with extended sessions showing/not showing. # Removed logic around gapUp/gapDown. # ... # Added 1hr chart beforestart/afterend workaround using secondsfromtime instead of gettime() # ... declare upper; declare hide_on_daily; declare once_per_bar; def vClose = close; def nan = Double.NaN; # debug and extra indicator flags # could make input variables, but that makes # the study name longer, and most people # probably want these off by default def showPrevClose = 0; def showOpen = 0; # logic def isRollover = GetYYYYMMDD() != GetYYYYMMDD()[1]; def beforeStart = if getaggregationperiod()==aggregationPeriod.HOUR then secondsfromTime(0900)<0 else GetTime() < RegularTradingStart(GetYYYYMMDD()); def afterEnd = if getaggregationperiod()==aggregationPeriod.HOUR then secondsfromTime(1600)>0 else GetTime() > RegularTradingEnd(GetYYYYMMDD()); def firstBarOfDay = if (beforeStart[1] == 1 and beforeStart == 0) or (isRollover and beforeStart == 0) then 1 else 0; def lastBarOfDay = if (afterEnd[-1] == 1 and afterEnd == 0) or (isRollOver[-1] and firstBarOfDay[-1]) then 1 else 0; def dayOpen = if firstBarOfDay then vClose else dayOpen[1]; def prevDayClose = if lastBarOfDay then vClose else prevDayClose[1]; # fibs def delta = if firstBarOfDay then dayOpen - prevDayClose else delta[1]; def fib1272 = if firstBarOfDay then prevDayClose + delta * 1.272 else fib1272[1]; # colors, see https://usethinkscript.com/threads/rainbow-indicators-%E2%80%93-bb-and-moving-average.294/ # # plots # Plot nan on the bar before a new plot starts on firstBarOfDay. # This causes the plot to draw without an annoying connecting line from # one day to the next. # plot fib = if firstBarOfDay[-1] then nan else fib1272; fib.SetDefaultColor(CreateColor(0,0,255)); #fib.assignvalueColor(if close >fib then color.green else color.red); fib.setlineWeight(5); plot pOpen = if showOpen and !firstBarOfDay[-1] then dayOpen else nan; plot pPrevClose = if showPrevClose and !lastBarOfDay[-1] then prevDayClose else nan; pOpen.SetDefaultColor(CreateColor(0,255,0)); pPrevClose.SetDefaultColor(CreateColor(255,0,0)); #
Join useThinkScript to post your question to a community of 21,000+ developers and traders.
Start a new thread and receive assistance from our community.
useThinkScript is the #1 community of stock market investors using indicators and other tools to power their trading strategies. Traders of all skill levels use our forums to learn about scripting and indicators, help each other, and discover new ways to gain an edge in the markets.
We get it. Our forum can be intimidating, if not overwhelming. With thousands of topics, tens of thousands of posts, our community has created an incredibly deep knowledge base for stock traders. No one can ever exhaust every resource provided on our site.
If you are new, or just looking for guidance, here are some helpful links to get you started.