trashcompactor
New member
My question is if it doesn't exist, could someone code an indicator that counts the values of the MACD and identifies the peak and lows.
Above Zero:
The MACD would count the values as momentum increases then once the value decreases, it would create an alert. I'll use simple numbers for demonstration. So 1, 2,3,4,5,4,3, etc. In this sample, the 5 would be the peak and the alert would come when the 4 is completed. In scenarios where the value increases again, the counting would restart. So 1,2,3,4,5,4,3,4,3,2 means the peak would be at 5 and would alert at 4 like mentioned before. But then the value increases again with the third 4 in the sequence. In this case, you would get an alert once the following number, 3, is completed.
Below Zero:
Same protocols but with negative numbers. I'll give an example. -1,-2,-3,-4,-5,-4,-3, etc. In this set, the -5 would be the peak and the alert would trigger on the following number, -4.
Please point me in the right direction or provide the code.
Thank you.
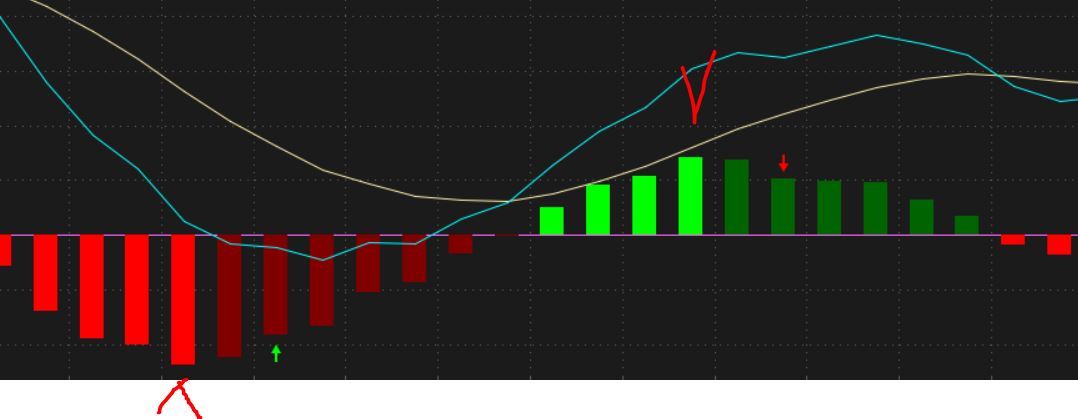
Here is a visual on what I am describing. I have marked where the peaks are and the alert would follow right after.

Above Zero:
The MACD would count the values as momentum increases then once the value decreases, it would create an alert. I'll use simple numbers for demonstration. So 1, 2,3,4,5,4,3, etc. In this sample, the 5 would be the peak and the alert would come when the 4 is completed. In scenarios where the value increases again, the counting would restart. So 1,2,3,4,5,4,3,4,3,2 means the peak would be at 5 and would alert at 4 like mentioned before. But then the value increases again with the third 4 in the sequence. In this case, you would get an alert once the following number, 3, is completed.
Below Zero:
Same protocols but with negative numbers. I'll give an example. -1,-2,-3,-4,-5,-4,-3, etc. In this set, the -5 would be the peak and the alert would trigger on the following number, -4.
Please point me in the right direction or provide the code.
Thank you.
Here is a visual on what I am describing. I have marked where the peaks are and the alert would follow right after.