


mod note:
This is not a buy/sell indicator.
This study provides something more simple and more important
Most traders focus on patterns, indicators, oscillators, and crossovers while ignoring the actual battle between buyers and sellers. The LWPI forces you to think about that battle.
This can highlight situations where:
It plots in reverse: downward values appear upward, and upward values appear downward.
In my view, it isn’t particularly useful as a stand‑alone indicator.
That said this is used as part of my algo.
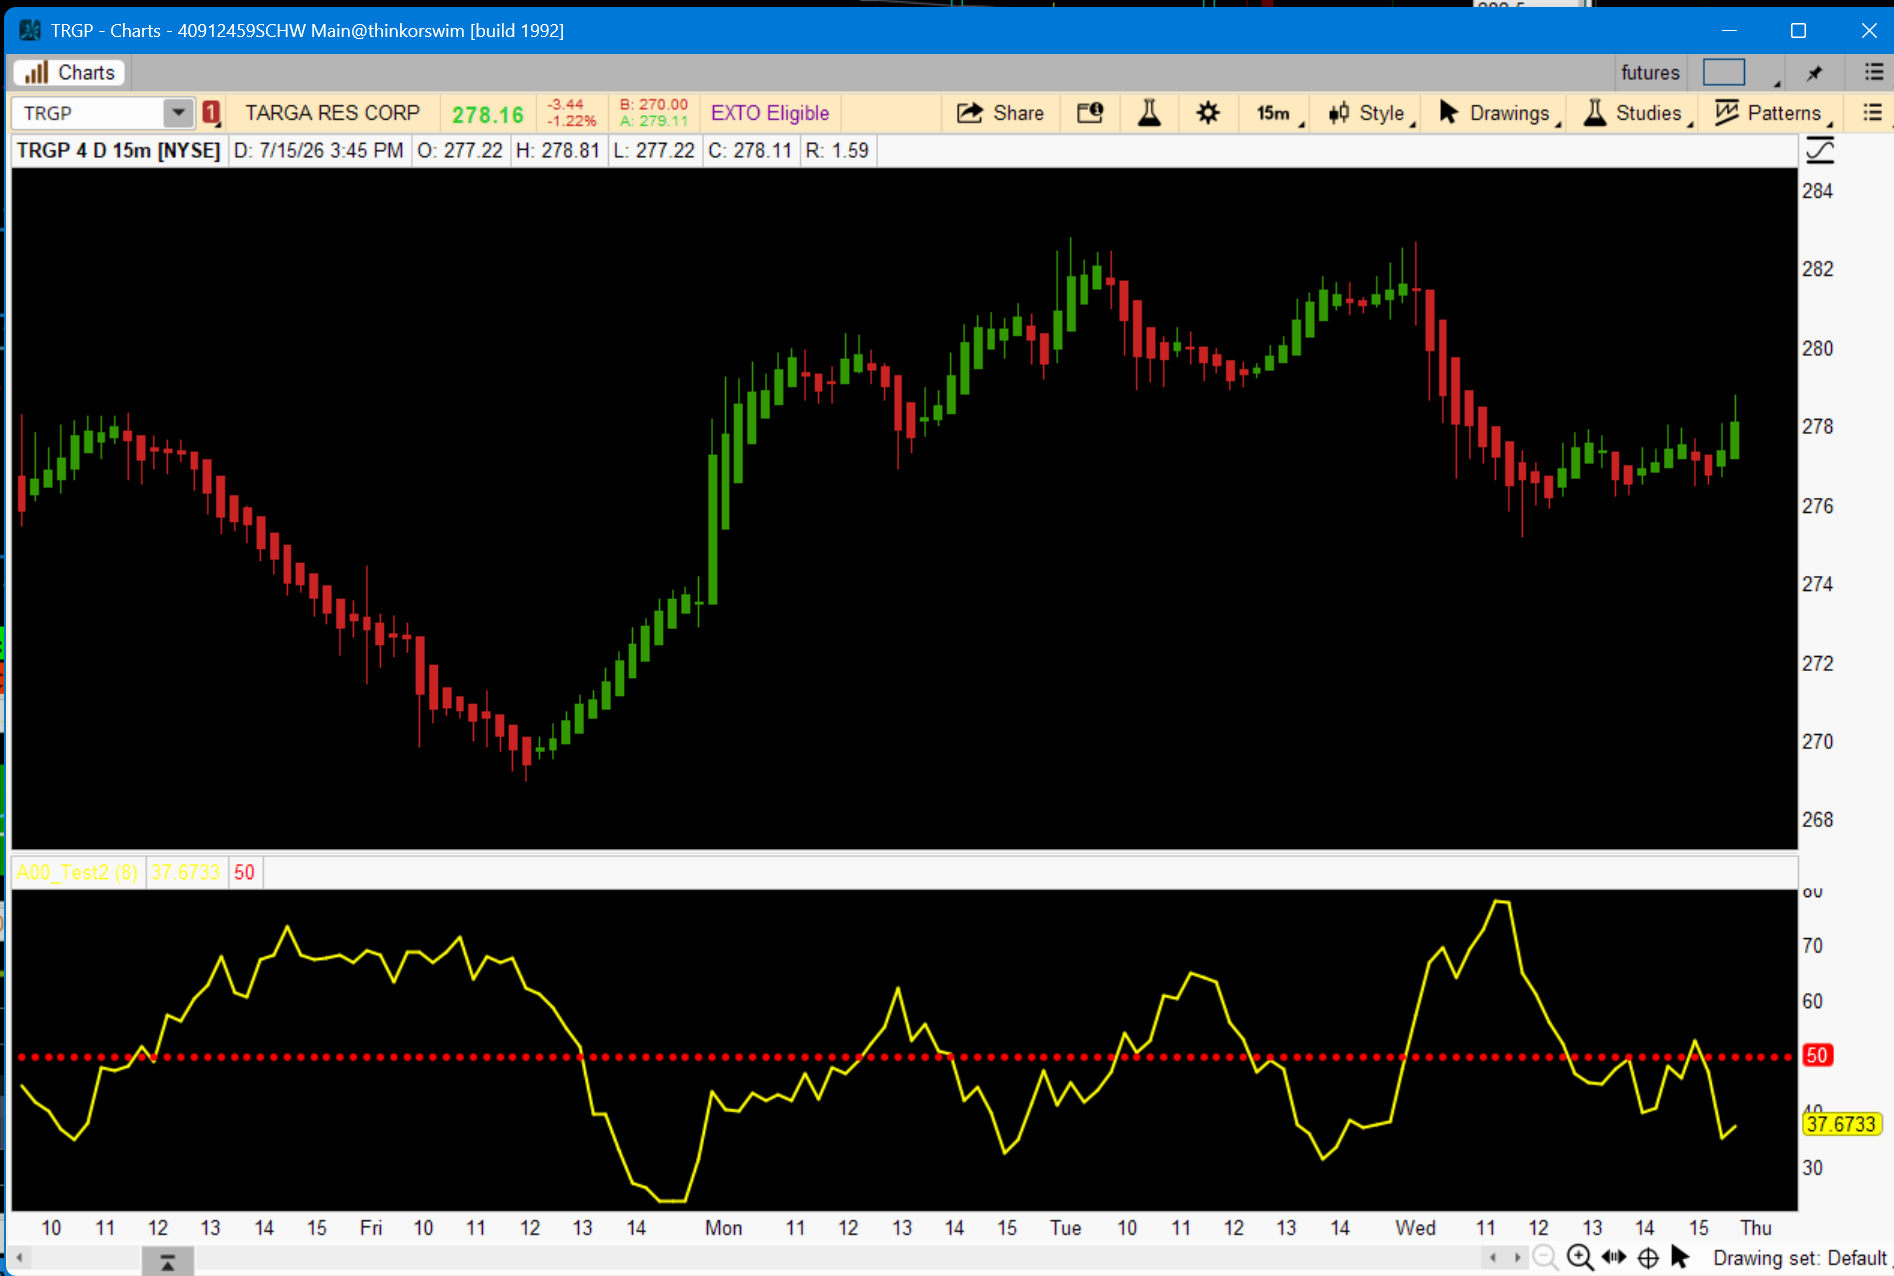
The LWPI attempts to measure how traders are behaving.
It is not looking for chart patterns or signal combinations.
It is evaluating whether buyers or sellers have been consistently winning the auction over the recent bars.
A strong move higher creates the fear of missing out. A sharp decline creates panic.
The LWPI helps counter that behavior by showing when buying or selling pressure may already be mature.
This is not a buy/sell indicator.
This study provides something more simple and more important
Who controls the auction?
Not based on one candle but the last several candles. Normalized by volatilityMost traders focus on patterns, indicators, oscillators, and crossovers while ignoring the actual battle between buyers and sellers. The LWPI forces you to think about that battle.
This can highlight situations where:
» Your indicators are bullish, but buyers are not controlling the auction very well.
» The market may continue higher, but buying pressure is deteriorating.
» Your indicators are bearish, but sellers are beginning to lose control.
» Price is still moving in one direction while participation is quietly shifting in the other.
It plots in reverse: downward values appear upward, and upward values appear downward.
In my view, it isn’t particularly useful as a stand‑alone indicator.
That said this is used as part of my algo.
ATR Normalization Is the Secret Sauce
By normalizing the calculation with ATR, the LWPI measures buying and selling pressure relative to the market's current volatility.A Behavioral Measurement, Not a Pattern Measurement
Most indicators measure where price is.The LWPI attempts to measure how traders are behaving.
It is not looking for chart patterns or signal combinations.
It is evaluating whether buyers or sellers have been consistently winning the auction over the recent bars.
Why It Helps Your Trading
One of the biggest mistakes traders can make is chasing price.A strong move higher creates the fear of missing out. A sharp decline creates panic.
The LWPI helps counter that behavior by showing when buying or selling pressure may already be mature.
» It does not tell you to buy.
» It does not tell you to sell.
» It simply provides context about who has been controlling the auction and whether that control appears to be strengthening or weakening.
Code:
# Larry Commercial Proxy Index (LWPI)
# Thinkorswim Conversion
# Original © Gehtsoft USA LLC / Mario Jemic

declare lower;

input Length = 8;

#-----------------------------------------
# Raw = Open - Close
#-----------------------------------------
def Raw = open - close;

#-----------------------------------------
# SMA of Raw
#-----------------------------------------
def MA = Average(Raw, Length);

#-----------------------------------------
# ATR (TOS native)
#-----------------------------------------
def ATR = ATR(Length);

#-----------------------------------------
# LWPI Calculation
# LWPI = 50 * MA / ATR + 50
#-----------------------------------------
def LWPI =
    if ATR != 0 then
        50 * (MA / ATR) + 50
    else 0;

#-----------------------------------------
# Plot
#-----------------------------------------
plot pLWPI = LWPI;
pLWPI.SetDefaultColor(Color.YELLOW);
pLWPI.SetLineWeight(2);

# Level at 50
plot Level50 = 50;
Level50.SetDefaultColor(Color.RED);
Level50.SetStyle(Curve.POINTS);
Level50.SetLineWeight(2);
Last edited by a moderator:


