Lower Chart Heiken Ashi With Candles

jjwint

New member
My deepest apologies if my answer is already somewhere in the vast collection of scripts that have been shared on this site!

But I'm not seeing it.

I would like to display price in the top part of my screen where price usually goes using whatever APPEARANCE setting I select. It might be a Line, or Bar, or Candle, Equivolume of whatever CHART TYPE I select.

But then, in a LOWER box, I'd like to see Heiken-Ashi. Not some representation but actual HA bars. I want it to look exactly like as if I had selected Heiken Ashi under APPEARANCE . . . but it shows up in a Lower part of the chart.

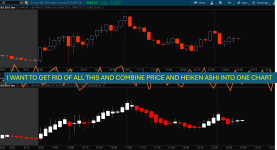
I've tried to show in the attached picture how I envision this. I can do it now by simply stacking one chart on top of the other as show. But then you have the heading and bottom of the chart which eats up a lot of screen.

Again, sorry if this has already been done but I haven't found it.

Thank you
 

Attachments

  • PRICE HA COMBINED.png
    PRICE HA COMBINED.png
    270.1 KB · Views: 64
Solution
I think this will be close to what you're looking for. It uses a deprecated function (that nonetheless has been somewhat useable for a while but MAY BE REMOVED AT ANY TIME WITHOUT WARNING OR NOTIFICATION FROM SCHWAB).

USE THIS SCRIPT AT YOUR OWN RISK

adjusting parameters may break your installation


Code:
declare lower;


def ha_close = (high + low + open + close) / 4;
def ha_open = (open[1] + close[1]) / 2;
def ha_high = max(max(high, open), close);
def ha_low = min(min(low, open), close);
def ha_hlc3 = (ha_high + ha_low + ha_close) / 3;

AddChart(type=chartType.HEIKIN_ASHI, 
high = if ha_open > ha_close then ha_high else double.nan, 
low = if ha_open > ha_close then ha_low else double.nan, 
open = if ha_open > ha_close...
I think this will be close to what you're looking for. It uses a deprecated function (that nonetheless has been somewhat useable for a while but MAY BE REMOVED AT ANY TIME WITHOUT WARNING OR NOTIFICATION FROM SCHWAB).

USE THIS SCRIPT AT YOUR OWN RISK

adjusting parameters may break your installation


Code:
declare lower;


def ha_close = (high + low + open + close) / 4;
def ha_open = (open[1] + close[1]) / 2;
def ha_high = max(max(high, open), close);
def ha_low = min(min(low, open), close);
def ha_hlc3 = (ha_high + ha_low + ha_close) / 3;

AddChart(type=chartType.HEIKIN_ASHI, 
high = if ha_open > ha_close then ha_high else double.nan, 
low = if ha_open > ha_close then ha_low else double.nan, 
open = if ha_open > ha_close then ha_open else double.nan, 
close = if ha_open > ha_close then ha_close else double.nan, 
growColor = Color.DOWNTICK, fallColor = Color.DOWNTICK, neutralColor = Color.WHITE);


AddChart(type=chartType.HEIKIN_ASHI, 
high = if ha_open <= ha_close then ha_high else double.nan, 
low = if ha_open <= ha_close then ha_low else double.nan, 
open = if ha_open <= ha_close then ha_open else double.nan, 
close = if ha_open <= ha_close then ha_close else double.nan, 
growColor = Color.UPTICK, fallColor = Color.UPTICK, neutralColor = Color.WHITE);

-mashume

P.S. Do NOT use any chart types other than HA and candle and maybe candle trend. others may crash your installation of ToS (especially area and equivolume) Just Don't.
 
Solution

Join useThinkScript to post your question to a community of 21,000+ developers and traders.

Not the exact question you're looking for?

Start a new thread and receive assistance from our community.

87k+ Posts
381 Online
Create Post

The Market Trading Game Changer

Join 2,500+ subscribers inside the useThinkScript VIP Membership Club
  • Exclusive indicators
  • Proven strategies & setups
  • Private Discord community
  • ‘Buy The Dip’ signal alerts
  • Exclusive members-only content
  • Add-ons and resources
  • 1 full year of unlimited support

Frequently Asked Questions

What is useThinkScript?

useThinkScript is the #1 community of stock market investors using indicators and other tools to power their trading strategies. Traders of all skill levels use our forums to learn about scripting and indicators, help each other, and discover new ways to gain an edge in the markets.

How do I get started?

We get it. Our forum can be intimidating, if not overwhelming. With thousands of topics, tens of thousands of posts, our community has created an incredibly deep knowledge base for stock traders. No one can ever exhaust every resource provided on our site.

If you are new, or just looking for guidance, here are some helpful links to get you started.

What are the benefits of VIP Membership?
VIP members get exclusive access to these proven and tested premium indicators: Buy the Dip, Advanced Market Moves 2.0, Take Profit, and Volatility Trading Range. In addition, VIP members get access to over 50 VIP-only custom indicators, add-ons, and strategies, private VIP-only forums, private Discord channel to discuss trades and strategies in real-time, customer support, trade alerts, and much more. Learn all about VIP membership here.
How can I access the premium indicators?
To access the premium indicators, which are plug and play ready, sign up for VIP membership here.
Back
Top