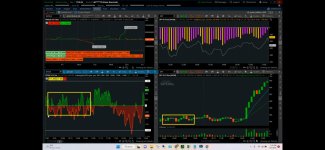
Looking for tick script

xasthur

New member
Can someone replicate the cumulative tick script on the bottom left ?
 

Attachments

  • Screenshot_20240615_125247_Samsung Internet.jpg
    Screenshot_20240615_125247_Samsung Internet.jpg
    172.9 KB · Views: 137
Last edited by a moderator:
Solution
Can someone replicate the cumulative tick script on the bottom left ?

That can't be cumulative, it falls to well within the typical range of the raw data. I'd bet it's just the the raw $TICK highs and lows, capped at zero on either end, displayed as clouds.

xeoO2KM.png


Code:
declare lower;
def TOP = Max(high("$TICK"),0);
def BOT = Min(Low("$TICK"),0);
addcloud(TOP,0,color.green, color.green, yes);
addcloud(0,BOT,color.red, color.red, yes);
plot posThou = 1000;
posThou.setdefaultColor(color.gray);
plot negThou = -1000;
negThou.setdefaultColor(color.gray);
 
Solution
That can't be cumulative, it falls to well within the typical range of the raw data. I'd bet it's just the the raw $TICK highs and lows, capped at zero on either end, displayed as clouds.

xeoO2KM.png


Code:
declare lower;
def TOP = Max(high("$TICK"),0);
def BOT = Min(Low("$TICK"),0);
addcloud(TOP,0,color.green, color.green, yes);
addcloud(0,BOT,color.red, color.red, yes);
plot posThou = 1000;
posThou.setdefaultColor(color.gray);
plot negThou = -1000;
negThou.setdefaultColor(color.gray);
thanks, you are the best!
 
thanks, you are the best!

I posted a group of exploratory scripts under the following topic that had/can use TICK symbols. The application of thinkScript may otherwise be of use to you, in part, if interested.

https://usethinkscript.com/threads/scripting-for-vold-histogram.16535/

The below script is Cumulative Tick displayed as a histogram, any one symbol can be manually entered in the ticker box or chosen in the drop down list by way of the (Beaker Icon) -> "Edit Studies" -> "Gear Icon" next to the applied study name.

If you prefer the appearance as shown in the picture you posted, I imagine the code Joshua provided can be applied to this script.

I suggest you do a general search for "TICK" topics on these forums, it is or has been a popular subject with any number of interesting script applications.


Code:
#Cumulative TICK (All Symbols)

#TICK Symbols List:

#$TICK – NYSE
#$TICKC – NYSE composite
#$TICK/Q – Nasdaq
#$TICKC/Q – Nasdaq composite
#$TIKRL – Russell 2000
#$TIKRLC – Russell 2000 composite
#$TIKI – DJIA
#$TIKIC – DJIA composite
#$TIKND – Nasdaq 100
#$TIKNDC – Nasdaq 100 composite
#$TIKSP – S&P 500
#$TIKSPC – S&P 500 composite
#$TICKA – Amex
#$TICKAC – Amex composite
#$TICKAR – ARCA
#$TICKARC – ARCA composite
#$TIKUS – All USA
#$TIKUSC – All USA composite


declare lower;

input TickType = {default "$TICK", "$TICKC", "$TICK/Q", "$TICKC/Q", "$TIKRL", "$TIKRLC", "$TIKI", "$TIKIC", "$TIKND", "$TIKNDC", "$TIKSP", "$TIKSPC", "$TICKA", "$TICKAC", "$TICKAR", "$TICKARC", "$TIKUS", "$TIKUSC"};

def value = (hlc3(TickType));
plot data = value;
data.SetPaintingStrategy(PaintingStrategy.LINE);
data.assignValueColor(color.CYAN);

def tickData = (hlc3(TickType));

rec CT = if GetDay() != GetDay()[1] then 0 else if SecondsTillTime(930) <= 0 and SecondsTillTime(1600) >= 0 then CT[1] + tickData else 0;
plot cumulativeTick = if !IsNaN(tickData) then CT else Double.NaN;

cumulativeTick.SetPaintingStrategy(PaintingStrategy.HISTOGRAM);

cumulativeTick.AssignValueColor(if cumulativeTick < cumulativeTick [1] then Color.DOWNTICK
else Color.UPTICK);

cumulativeTick.SetLineWeight(4);

def newDay = GetDay() != GetDay()[1];
AddVerticalLine(newDay, "", color.DARK_GRAY, curve.FIRM);

plot zero = 0;
zero.AssignValueColor(GetColor(4));
zero.HideBubble();
zero.HideTitle();
 

Join useThinkScript to post your question to a community of 21,000+ developers and traders.

Similar threads

Not the exact question you're looking for?

Start a new thread and receive assistance from our community.

87k+ Posts
467 Online
Create Post

Similar threads

Similar threads

The Market Trading Game Changer

Join 2,500+ subscribers inside the useThinkScript VIP Membership Club
  • Exclusive indicators
  • Proven strategies & setups
  • Private Discord community
  • ‘Buy The Dip’ signal alerts
  • Exclusive members-only content
  • Add-ons and resources
  • 1 full year of unlimited support

Frequently Asked Questions

What is useThinkScript?

useThinkScript is the #1 community of stock market investors using indicators and other tools to power their trading strategies. Traders of all skill levels use our forums to learn about scripting and indicators, help each other, and discover new ways to gain an edge in the markets.

How do I get started?

We get it. Our forum can be intimidating, if not overwhelming. With thousands of topics, tens of thousands of posts, our community has created an incredibly deep knowledge base for stock traders. No one can ever exhaust every resource provided on our site.

If you are new, or just looking for guidance, here are some helpful links to get you started.

What are the benefits of VIP Membership?
VIP members get exclusive access to these proven and tested premium indicators: Buy the Dip, Advanced Market Moves 2.0, Take Profit, and Volatility Trading Range. In addition, VIP members get access to over 50 VIP-only custom indicators, add-ons, and strategies, private VIP-only forums, private Discord channel to discuss trades and strategies in real-time, customer support, trade alerts, and much more. Learn all about VIP membership here.
How can I access the premium indicators?
To access the premium indicators, which are plug and play ready, sign up for VIP membership here.
Back
Top