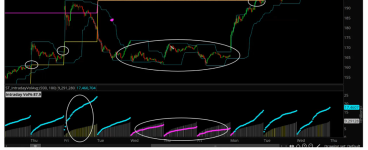
I recently watched a presentation and something I saw was very interesting. The presenter was showing intra-day charts with volume using the TOS platform. Below is an image of the volume indicator.
The vertical bars on the bottom indicator are the average daily cumulative volume for one day. The blue line is the volume for that day. The chart makes it very easy to compare daily volume to average volume.
Any chance anyone here can duplicate this? I think it would be very handy when considering entering or exiting a trade.
Thanks.

