
I have been trying to create a study that does forecasting using a simple multiple linear regression with more than one independent variables (covariates such as Price, Relative Volume, and RSI). This multiple regression model serves as a training model. After training the linear regression model using the data in the past (e.g., 90 days before), the program calculates the coefficient estimates for each independent variable and use them to make predictions in the future using the current data feed. This method is similar to cross-validation across multiple time periods (i.e., training in PERIOD 1 and testing in PERIOD 2).
In the following equation, t (current period), t-1 (previous period), t-2 (two period in the past), ... , t+1 (next period)
Y(t-1) = beta(0) + beta(1)*X1(t-2) + beta(2)*X2(t-2) + beta(3)*X3(t-2) + Error
After estimating betas, I calculate Y(t+1) using X1~X3 at t.
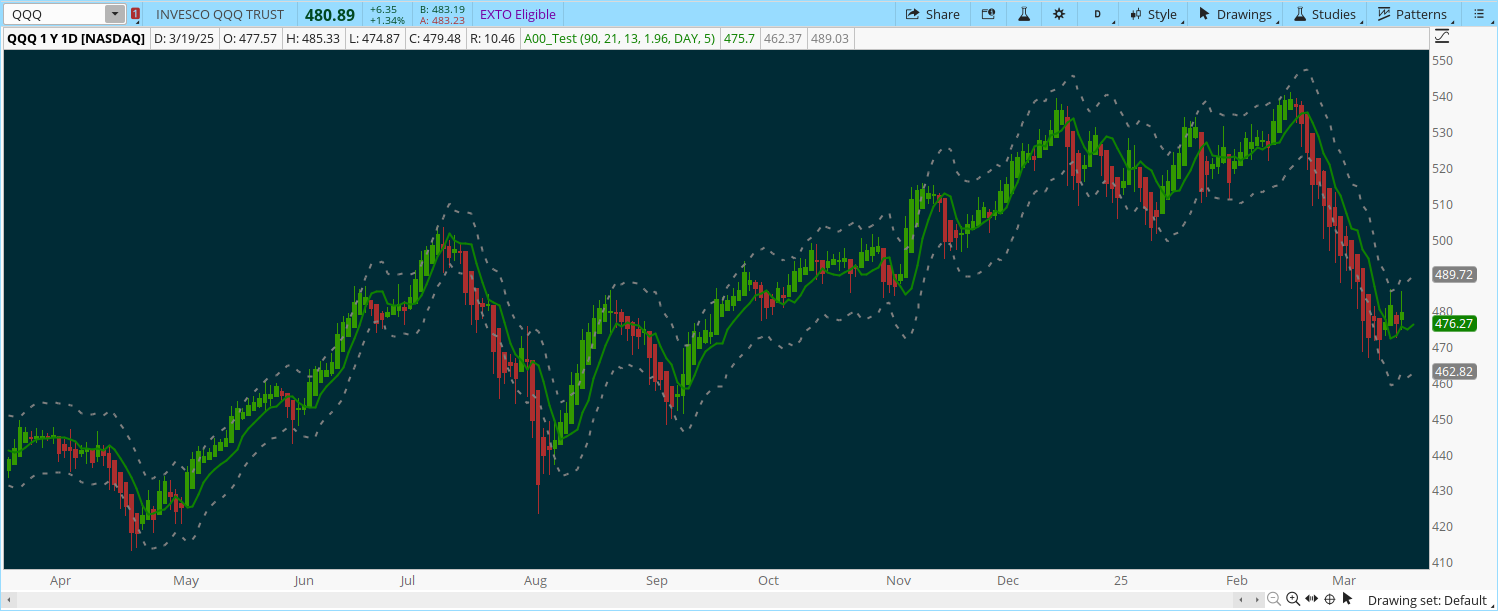
Then, I can also calculate and draw the lower and upper bounds of 95% confidence intervals.
I can also calculate R-squared to see how much of the training model explains the variation in the past price movement.
Obviously, this simple linear regression may produce biased estimates.
But I just want to make a simple running model before I can incorporate other statistical factors.
Please see the following codes of a multiple regression. I want to warn you that there may be logic errors. I myself, as a noob coder, cannot trust this. This is the only place where I may be able to get some feedback.
In the following equation, t (current period), t-1 (previous period), t-2 (two period in the past), ... , t+1 (next period)
Y(t-1) = beta(0) + beta(1)*X1(t-2) + beta(2)*X2(t-2) + beta(3)*X3(t-2) + Error
After estimating betas, I calculate Y(t+1) using X1~X3 at t.
Then, I can also calculate and draw the lower and upper bounds of 95% confidence intervals.
I can also calculate R-squared to see how much of the training model explains the variation in the past price movement.
Obviously, this simple linear regression may produce biased estimates.
But I just want to make a simple running model before I can incorporate other statistical factors.
Please see the following codes of a multiple regression. I want to warn you that there may be logic errors. I myself, as a noob coder, cannot trust this. This is the only place where I may be able to get some feedback.
Code:
declare upper;

# Input parameters
input n = 90;                           # Lookback period (number of bars)
input avgLength = 21;            # Period for average volume calculation
input rsiLength = 13;               # RSI length
input confMultiplier = 1.96;       # Confidence multiplier (~1.96 for a 95% CI)
input aggPeriod = AggregationPeriod.DAY;
input smoothPeriod = 5;             # Period for smoothing (5-period simple moving average)

# -----------------------------------------------------
# Build the regression sample (using lagged values)
# -----------------------------------------------------
# Dependent variable: Price at the end of the previous bar (e.g., yesterday's 8 PM price if daily)
def regY = close(period = aggPeriod)[1];
# Predictor 1: Price from one bar before regY (e.g., yesterday's close if daily)
def regX1 = close(period = aggPeriod)[2];
# Predictor 2: Relative volume from the same bar as regX1 (volume divided by its average)
def regX2 = volume(period = aggPeriod)[2] / Average(volume(period = aggPeriod), avgLength);
# Predictor 3: RSI from the same bar as regX1
def rsiVal = RSI(price = close(period = aggPeriod), length = rsiLength);
def regX3 = rsiVal[2];

# -----------------------------------------------------
# Compute rolling sums and means over n bars (training sample)
# -----------------------------------------------------
def sumY  = Sum(regY, n);
def sumX1 = Sum(regX1, n);
def sumX2 = Sum(regX2, n);
def sumX3 = Sum(regX3, n);

def meanY  = sumY / n;
def meanX1 = sumX1 / n;
def meanX2 = sumX2 / n;
def meanX3 = sumX3 / n;

def sumX1Sq = Sum(regX1 * regX1, n);
def sumX2Sq = Sum(regX2 * regX2, n);
def sumX3Sq = Sum(regX3 * regX3, n);

def sumX1X2 = Sum(regX1 * regX2, n);
def sumX1X3 = Sum(regX1 * regX3, n);
def sumX2X3 = Sum(regX2 * regX3, n);

def sumX1Y = Sum(regX1 * regY, n);
def sumX2Y = Sum(regX2 * regY, n);
def sumX3Y = Sum(regX3 * regY, n);

# -----------------------------------------------------
# Compute deviation (covariance) sums
# -----------------------------------------------------
def S11 = sumX1Sq - n * meanX1 * meanX1;
def S22 = sumX2Sq - n * meanX2 * meanX2;
def S33 = sumX3Sq - n * meanX3 * meanX3;
def S12 = sumX1X2 - n * meanX1 * meanX2;
def S13 = sumX1X3 - n * meanX1 * meanX3;
def S23 = sumX2X3 - n * meanX2 * meanX3;

def SY1 = sumX1Y - n * meanX1 * meanY;
def SY2 = sumX2Y - n * meanX2 * meanY;
def SY3 = sumX3Y - n * meanX3 * meanY;

# -----------------------------------------------------
# Compute regression coefficients using Cramer's Rule
# -----------------------------------------------------
def D = S11 * (S22 * S33 - S23 * S23) -
        S12 * (S12 * S33 - S23 * S13) +
        S13 * (S12 * S23 - S22 * S13);

def beta1 = if D <> 0 then (SY1 * (S22 * S33 - S23 * S23) -
                             S12 * (SY2 * S33 - S23 * SY3) +
                             S13 * (SY2 * S23 - S22 * SY3)) / D else 0;
def beta2 = if D <> 0 then (S11 * (SY2 * S33 - S23 * SY3) -
                             SY1 * (S12 * S33 - S23 * S13) +
                             S13 * (S12 * SY3 - SY2 * S13)) / D else 0;
def beta3 = if D <> 0 then (S11 * (S22 * SY3 - S23 * SY2) -
                             S12 * (S12 * SY3 - S23 * SY1) +
                             SY1 * (S12 * S23 - S22 * S13)) / D else 0;
def beta0 = meanY - beta1 * meanX1 - beta2 * meanX2 - beta3 * meanX3;

# -----------------------------------------------------
# Estimate in-sample error variance and compute sigmaHat
# -----------------------------------------------------
def Yhat_train = beta0 + beta1 * regX1 + beta2 * regX2 + beta3 * regX3;
def residual = regY - Yhat_train;
def SSE = Sum(residual * residual, n);
def MSE = if (n - 4) > 0 then SSE / (n - 4) else 0;
def sigmaHat = Sqrt(MSE);

# -----------------------------------------------------
# Forecast using the current period's values (today's available data)
# -----------------------------------------------------
def forecastClose = close(period = aggPeriod);
def forecastRelVol = volume(period = aggPeriod) / Average(volume(period = aggPeriod), avgLength);
def forecastRSI = RSI(price = close(period = aggPeriod), length = rsiLength);
def pForecast = beta0 + beta1 * forecastClose + beta2 * forecastRelVol + beta3 * forecastRSI;

# -----------------------------------------------------
# Calculate the 95% Confidence Interval bounds
# -----------------------------------------------------
def pLowerBound = pForecast - confMultiplier * sigmaHat;
def pUpperBound = pForecast + confMultiplier * sigmaHat;

# -----------------------------------------------------
# Smoothing EMA
# -----------------------------------------------------
def smoothForecast = MovAvgExponential(pForecast, smoothPeriod);
def smoothLowerBound = MovAvgExponential(pLowerBound, smoothPeriod);
def smoothUpperBound = MovAvgExponential(pUpperBound, smoothPeriod);

# -----------------------------------------------------
# Plot the Forecast and Confidence Bounds
# -----------------------------------------------------
plot ForecastPrice = smoothForecast[2];
ForecastPrice.SetDefaultColor(GetColor(1));
ForecastPrice.SetLineWeight(2);
ForecastPrice.SetStyle(Curve.FIRM);

plot LowerBound = smoothLowerBound[2];
LowerBound.SetDefaultColor(Color.GRAY);
LowerBound.SetLineWeight(1);
LowerBound.SetStyle(Curve.Short_DASH);

plot UpperBound = smoothUpperBound[2];
UpperBound.SetDefaultColor(Color.GRAY);
UpperBound.SetLineWeight(1);
UpperBound.SetStyle(Curve.Short_DASH);
Last edited:
