
Author Message:
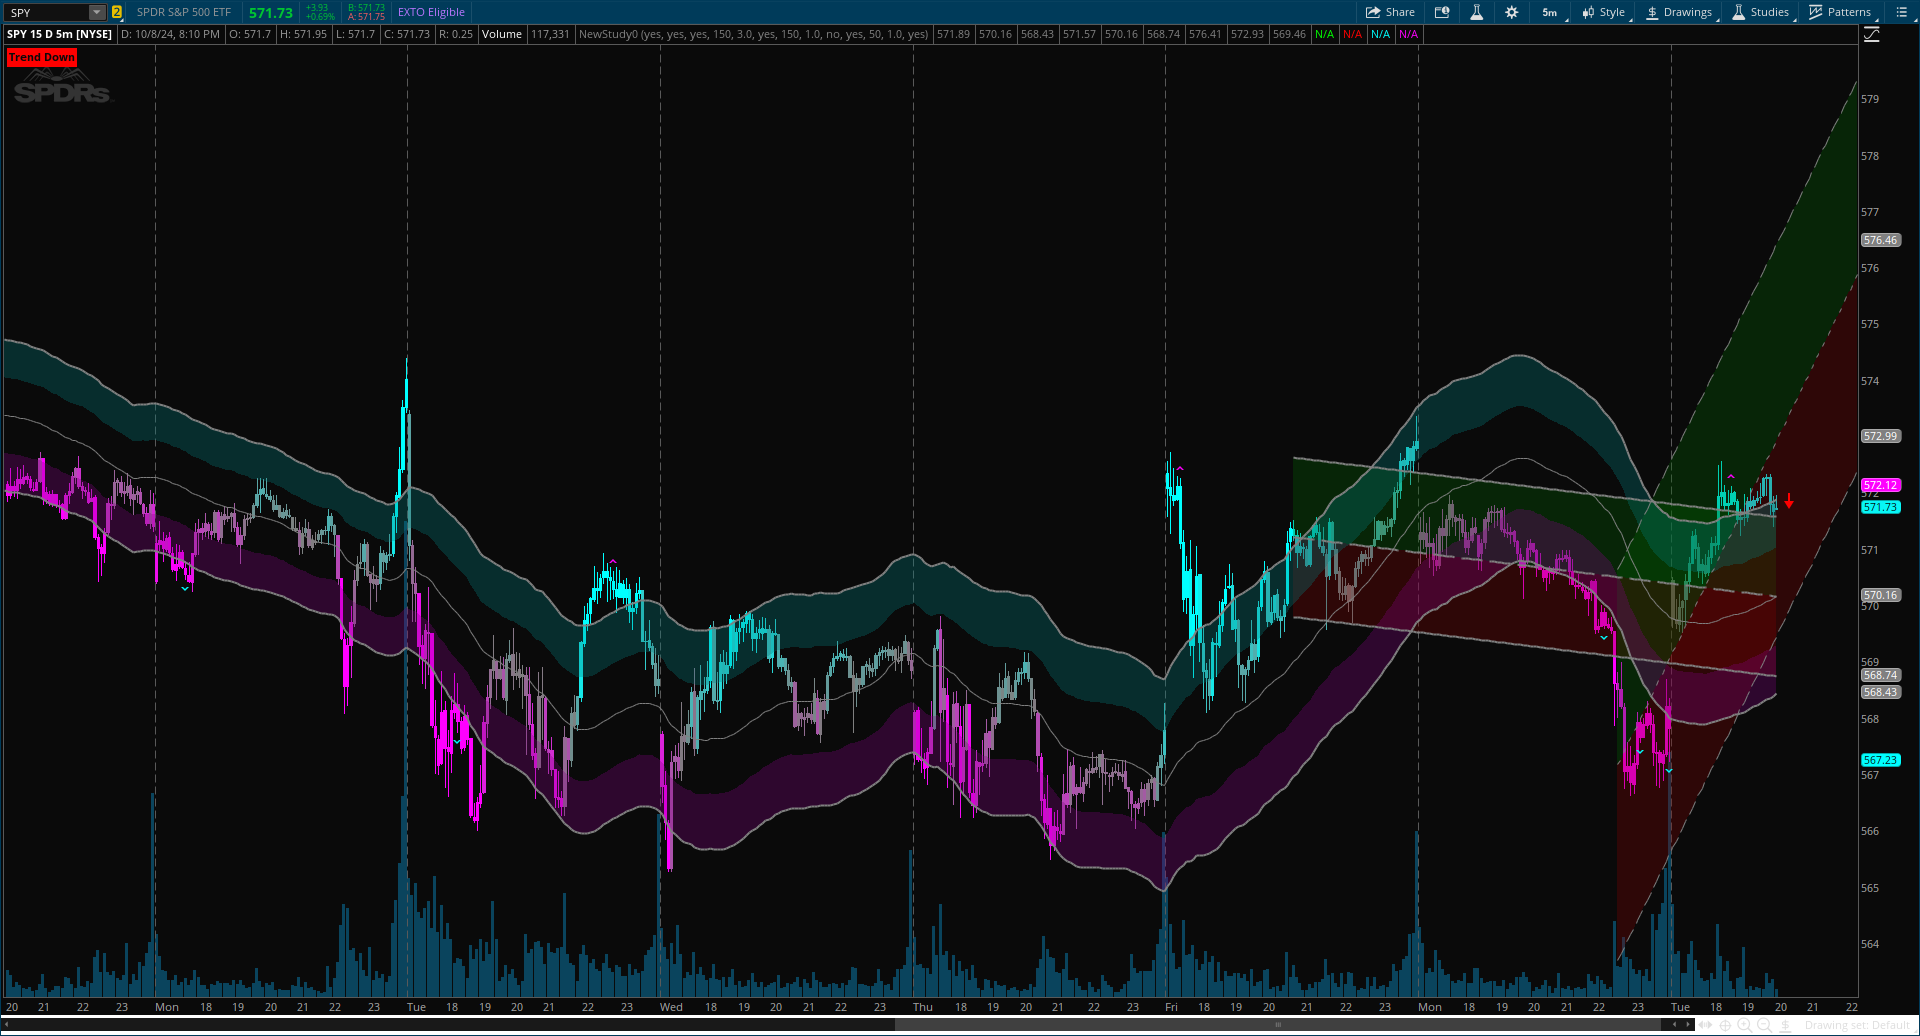
The Linear Regression Channel Indicator is a versatile tool designed for TradingView to help traders visualize price trends and potential reversal points. By calculating and plotting linear regression channels, bands, and future projections, this indicator provides comprehensive insights into market dynamics. It can highlight overbought and oversold conditions, identify trend direction, and offer visual cues for future price movements.
More Details : https://www.tradingview.com/script/7a8mTJpS-Linear-Regression-Channel/
Code:
CSS:
#// Indicator for TOS
#// © ChartPrime
#indicator('Linear Regression Channel', overlay = true, max_lines_count = 3)
# Converted by Sam4Cok@Samer800    - 10/2024

input colorBars = no;
input showDirectionLabel  = yes;            # "Plot Arrow Direction"
input LinearRegressionBands = yes;          # "Plot Linear Regression Bands"
input bandLength = 150;                     # "Length"
input bandDevMultiplier  = 3.0;             # "Deviation Linear Regression Bands"
input LinearRegressionChannel = no;         # "Plot Linear Regression Channel"
input channelLength = 150;                  # "Channel Length"
input channelDevMultiplier   = 1.0;         # "Deviation Linear Regression Channel"
input extendChannelLines = no;
input FutureProjectionChannel = no;         # "Plot Future Projection of linear regression"
input FutureProjectionLength = 50;          # "Length"
input FutureProjectionDevMultiplier  = 1.0; # "Deviation Future Projection Regression Channel"
input extendFutureProjectionChannel = yes;

def na = Double.NaN;
def last = IsNaN(close);

#//@function linear_regression
script linear_regression {
    input src = close;
    input window = 150;
    def sum_x = fold ix = 0 to window with px do
                px + (ix + 1);
    def sum_y = fold iy = 0 to window with py do
                py + src[iy];
    def sum_xy = fold ixy = 0 to window with pxy do
                pxy + ((ixy + 1) * src[ixy]);
    def sum_x_sq = fold isq = 0 to window with psq do
                   psq + Power(isq + 1, 2);
#    // Calculate linear regression coefficients
    def slope = (window * sum_xy - sum_x * sum_y) / (window * sum_x_sq - Power(sum_x, 2));
    def intercept = (sum_y - slope * sum_x) / window;
#    def y1 = intercept  + slope * (window - 1);
    def dev1 = fold i = 0 to window with p do
               p + Power(src[i] - (slope * (window - i) + intercept), 2);
    def dev = Sqrt(dev1 / window);
#    plot y1_ = y1;
    plot y2_ = intercept;
    plot dev_ = dev;
    plot slope_ = slope;
}

def y2    = linear_regression(close, bandLength).y2_;
def slope = linear_regression(close, bandLength).slope_;

def y2_    = linear_regression(close, channelLength).y2_;
def dev_   = linear_regression(close, channelLength).dev_;

def y2_1    = linear_regression(close, FutureProjectionLength).y2_;
def dev_1   = linear_regression(close, FutureProjectionLength).dev_;

#/ Linear Regression Band Lines
def mid   = y2 + slope;
def nAtr  = WildersAverage(high - low, bandLength);
def upper = mid + nAtr * bandDevMultiplier;
def lower = mid - nAtr * bandDevMultiplier;
#/ Linear Regression Channel Lines
def devMult = if !last then dev_ * channelDevMultiplier else devMult[1];
def midChan = InertiaAll(close, channelLength, extendToRight = extendChannelLines);
def lastDev = highestAll(inertiaAll(devMult, 2));
def upChan = inertiaAll(midChan + lastDev, channelLength, extendToRight = extendChannelLines);
def loChan = inertiaAll(midChan - lastDev, channelLength, extendToRight = extendChannelLines);
#/ Linear Regression future Channel Lines
def devMultF = if !last then dev_1 * FutureProjectionDevMultiplier else devMultF[1];
def midChanF = InertiaAll(close, FutureProjectionLength, extendToRight = extendFutureProjectionChannel);
def lastDevF = highestAll(inertiaAll(devMultF, 2));
def upChanF = inertiaAll(midChanF + lastDevF, FutureProjectionLength, extendToRight = extendFutureProjectionChannel);
def loChanF = inertiaAll(midChanF - lastDevF, FutureProjectionLength, extendToRight = extendFutureProjectionChannel);

#/ Plot upper, lower, and mid lines if channel is not enabled
plot bandUp  = if LinearRegressionBands then upper else na;
plot bandMid = if LinearRegressionBands then mid else na;
plot bandLo  = if LinearRegressionBands then lower else na;

plot LinRegChannelUp = if LinearRegressionChannel then upChan else na;
plot linRegMidLine   = if LinearRegressionChannel then midChan else na;
plot LinRegChannelLo = if LinearRegressionChannel then loChan else na;

plot LinRegChannelUpF = if FutureProjectionChannel then upChanF else na;
plot linRegMidLineF   = if FutureProjectionChannel then midChanF else na;
plot LinRegChannelLoF = if FutureProjectionChannel then loChanF else na;

bandUp.SetLineWeight(2);
bandLo.SetLineWeight(2);
bandUp.SetDefaultColor(Color.GRAY);
bandMid.SetDefaultColor(Color.GRAY);
bandLo.SetDefaultColor(Color.GRAY);

LinRegChannelUp.SetLineWeight(2);
linRegMidLine.SetLineWeight(2);
LinRegChannelLo.SetLineWeight(2);
LinRegChannelUp.SetDefaultColor(Color.GRAY);
linRegMidLine.SetDefaultColor(Color.GRAY);
LinRegChannelLo.SetDefaultColor(Color.GRAY);
linRegMidLine.SetStyle(Curve.LONG_DASH);

LinRegChannelUpF.SetStyle(Curve.MEDIUM_DASH);
linRegMidLineF.SetStyle(Curve.SHORT_DASH);
LinRegChannelLoF.SetStyle(Curve.MEDIUM_DASH);
LinRegChannelUpF.SetDefaultColor(Color.GRAY);
linRegMidLineF.SetDefaultColor(Color.GRAY);
LinRegChannelLoF.SetDefaultColor(Color.GRAY);

AddCloud(LinRegChannelUp, linRegMidLine, Color.DARK_GREEN);
AddCloud(linRegMidLine, LinRegChannelLo, Color.DARK_RED);

AddCloud(LinRegChannelUpF, linRegMidLineF, Color.DARK_GREEN);
AddCloud(linRegMidLineF, LinRegChannelLoF, Color.DARK_RED);

AddCloud(bandUp, bandUp - (bandUp - bandMid) / 2, CreateColor(0, 127, 127));
AddCloud(bandMid - (bandMid - bandLo) / 2 , bandLo, Color.PLUM);

# arro Direction
def dir = if hl2 > y2_1 then 1 else if hl2 < y2_1 then -1 else 0;
def y2Last = if !showDirectionLabel then na else if !last then y2_1 else y2Last[1];
def lastHi = if !last then high else lastHi[1];
def lastLo = if !last then low else lastLo[1];

plot arrowUp = if last[3] then if hl2[4] > y2Last[4] then lastHi[-3] else na else na;
plot arrowDn = if last[3] then if hl2[4] < y2Last[4] then lastLo[-3] else na else na;
arrowUp.SetLineWeight(2);
arrowDn.SetLineWeight(2);
arrowUp.SetPaintingStrategy(PaintingStrategy.ARROW_UP);
arrowDn.SetPaintingStrategy(PaintingStrategy.ARROW_DOWN);
arrowUp.SetDefaultColor(Color.GREEN);
arrowDn.SetDefaultColor(Color.RED);

AddLabel(showDirectionLabel, if dir>0 then "Trend UP" else if dir<0 then "Trend Down" else "No Trend",
                             if dir>0 then Color.GREEN else if dir<0 then Color.RED else Color.GRAY);

#// Bar Heat Map
def b_c1 = (close - lower) / (upper - lower);
def b_c = if isNaN(b_c1) then 0 else if b_c1 > 1 then 1 else if b_c1 < 0 then 0 else b_c1;

def colGr = if b_c <= 0.5 then 0 else b_c * 255;
def colRe = if b_c >= 0.5 then 255 else b_c * 255;

AssignPriceColor(if !colorBars then Color.CURRENT else
    if b_c >= 0.5 then CreateColor(255-colGr, colGr, colGr) else CreateColor(255-colRe, colRe, 255-colRe));

#// Conditions for crossovers
Script Pivot {
    input series    = close;
    input leftBars  = 10;
    input rightBars = 10;
    input isHigh = yes;
    def na = Double.NaN;
    def HH = series == Highest(series, leftBars + 1);
    def LL = series == Lowest(series, leftBars + 1);
    def pivotRange = (leftBars + rightBars + 1);
    def leftEdgeValue = if series[pivotRange] ==0 then na else series[pivotRange];
    def pvtCond = !isNaN(series) and leftBars > 0 and rightBars > 0 and !isNaN(leftEdgeValue);
    def barIndexH = if pvtCond then
                    fold i = 1 to rightBars + 1 with p=1 while p do
                    series > GetValue(series, - i) else na;
    def barIndexL = if pvtCond then
                    fold j = 1 to rightBars + 1 with q=1 while q do
                    series < GetValue(series, - j) else na;
    def PivotPoint;
if isHigh {
    PivotPoint = if HH and barIndexH then series else na;
    } else {
    PivotPoint = if LL and barIndexL then series else na;
    }
    plot pvt = PivotPoint;
}
def pvtH = Pivot(high[3], 3, 3, yes);
def pvtL = Pivot(low[3], 3, 3, no);
plot SigUp = if pvtL and close < lower then low else na;
plot SigDn = if pvtH and close > upper then high else na;
SigUp.SetDefaultColor(Color.CYAN);
SigDn.SetDefaultColor(Color.MAGENTA);
SigUp.SetPaintingStrategy(PaintingStrategy.BOOLEAN_WEDGE_DOWN);
SigDn.SetPaintingStrategy(PaintingStrategy.BOOLEAN_WEDGE_UP);


#-- END of CODE