#// This source code is subject to the terms of the Mozilla Public License 2.0 at https://mozilla.org/MPL/2.0/
#// © blackcat1402
#study("[blackcat] L3 Banker Fund Flow Trend Oscillator", overlay=false)
# Converted and mod by Sam4Cok@Samer800 - 02/2023

declare lower;
#//functions
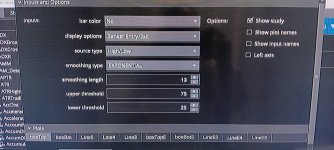
input BarColor = yes;
input SmoothingLength = 13;
def na = Double.NaN;
def last = IsNaN(close[1]);
#xrf(values, length) =>
script xrf {
    input values = close;
    input length = 34;
    def r_val;# = float(na)
    r_val = if length >= 1 then
                fold i = 0 to length + 1 with p=values do
             if IsNaN(p) or !IsNaN(values[i]) then values[i] else p else Double.NaN;
    plot out = r_val;
}
#xsa(src,len,wei) =>
script xsa {
    input src = close;
    input len = 5;
    input wei = 1;
    def sumf;# = 0.0
    def ma;# = 0.0
    def out;# = 0.0
    sumf = CompoundValue(1, sumf[1] - src[len] + src , src);
    ma   = if IsNaN(src[len]) then Double.NaN else sumf / len;
    out  = if IsNaN(out[1]) then ma else (src * wei + out[1] * (len - wei)) / len;
    plot return = out;
}
def wmCal = (close - Lowest(low, 27)) / (Highest(high, 27) - Lowest(low, 27)) * 100;

#//set up a simple model of banker fund flow trend
def fundtrend = (3 * xsa(wmCal, 5, 1) - 2 * xsa(xsa(wmCal, 5, 1), 3, 1) - 50) * 1.032 + 50;
#//define typical price for banker fund
def typ = (2 * close + high + low + open) / 5;
#//lowest low with mid term fib # 34
def lol = Lowest(typ, 34);
#//highest high with mid term fib # 34
def hoh = Highest(typ, 34);
#//define banker fund flow bull bear line
def bullbear = (typ - lol) / (hoh - lol) * 100;
def bullbearline = ExpAverage(bullbear, SmoothingLength);
#//define banker entry signal
def bankerentry = Crosses(fundtrend, bullbearline, CrossingDirection.ABOVE) and bullbearline < 25;
def bankerExit = Crosses(fundtrend, bullbearline, CrossingDirection.BELOW) and bullbearline > 75;

#//banker increase position with green candle
def UpCandle = fundtrend > bullbearline;
def WeakUp   = fundtrend < (xrf(fundtrend * 0.95, 1));
def DnCandle = fundtrend < bullbearline;
def WeakDn   = fundtrend < bullbearline and fundtrend > (xrf(fundtrend * 0.95, 1));

# Plot the new Chart
#//banker fund entry with yellow candle
AddChart(high = if bankerExit then 100 else na, low = 0 , open = 100,  close = 0,
         type = ChartType.CANDLE, growcolor =  Color.DARK_RED);

AddChart(high = if bankerentry then 100 else na, low = 0 , open = 100,  close = 0,
         type = ChartType.CANDLE, growcolor =  CreateColor(26, 70, 85));

AddChart(high = if UpCandle then bullbearline else na , low = fundtrend , open = fundtrend,  close =  bullbearline,
         type = ChartType.CANDLE, growcolor =  CreateColor(7, 205, 15));

AddChart(high = if WeakUp then bullbearline else na , low = fundtrend , open = fundtrend,  close = bullbearline,
         type = ChartType.CANDLE, growcolor =  CreateColor(188, 245, 188));

AddChart(high = if DnCandle then bullbearline else na , low = fundtrend , open = bullbearline,  close =   fundtrend,
         type = ChartType.CANDLE, growcolor =  Color.RED);

AddChart(high = if WeakDn then bullbearline else na , low = fundtrend , open = bullbearline,  close =   fundtrend,
         type = ChartType.CANDLE, growcolor =  Color.PINK);

#/overbought and oversold threshold lines
def h1 = if last then na else 80;
def h2 = if last then na else 20;
def h3 = 10;
def h4 = 90;
plot h5 = if last then na else 50;
h5.SetDefaultColor(Color.DARK_GRAY);

# Plot the new Chart
#//banker fund entry with yellow candle
plot SigUp = if bankerentry and !bankerentry[1] then 15 else 0;
plot SigDn = if bankerExit and !bankerExit[1] then 85 else 100;
SigUp.SetDefaultColor(Color.CYAN);
SigDn.SetDefaultColor(Color.MAGENTA);
Alert(bankerentry and !bankerentry[1], " BUY ", Alert.BAR, Sound.Ring);
Alert(bankerExit and !bankerExit[1], " SELL ", Alert.BAR, Sound.Bell);

AddCloud(h2, h3, CreateColor(157, 157, 0));#color=color.CYAN,transp=70)
AddCloud(h4, h1, CreateColor(157, 0 , 157));#=color.fuchsia,transp=70)

AssignPriceColor(if !BarColor then Color.CURRENT else
                 if bankerentry and !bankerentry[1] then Color.CYAN else
                 if bankerExit and !bankerExit[1] then Color.MAGENTA else
                 if bankerentry then Color.CYAN else
                 if bankerExit then Color.MAGENTA else
                 if WeakDn then Color.DARK_RED else
                 if DnCandle then Color.RED else
                 if WeakUp then Color.DARK_GREEN else
                 if UpCandle then Color.GREEN else Color.CURRENT);


#---- END CODE


plot OB = if fundtrend > 90 and fundtrend < 100 then 105 else na;
plot OBX = if fundtrend > 100 then 105 else na;
OB.SetDefaultColor(Color.DARK_RED);
OBX.SetDefaultColor(Color.WHITE);
OB.SetPaintingStrategy(PaintingStrategy.POINTS);
OBX.SetPaintingStrategy(PaintingStrategy.POINTS);

plot OSX = if fundtrend < 0 then -5 else na;
plot OS = if fundtrend < 10 and fundtrend > 0 then -5 else na;
OS.SetDefaultColor(Color.DARK_GREEN);
OSX.SetDefaultColor(Color.WHITE);
OS.SetPaintingStrategy(PaintingStrategy.POINTS);
OSX.SetPaintingStrategy(PaintingStrategy.POINTS);


def c = close;
def h = high;
def l = low;
def o = open;

script xrf {
    input values = close;
    input length = 34;
    def r_val = fold i = 0 to length + 1 with p=Double.NaN do
            if (IsNaN(p) or !IsNaN(values[i])) then values[i] else p;
    plot out = if length >= 1 then r_val else Double.NaN;
}
#xsa(src,len,wei) =>
script xsa {
    input src = close;
    input len = 5;
    input wei = 1;
    def sumf = CompoundValue(1, sumf[1] - src[len] + src , src);
    def ma   = if IsNaN(src[len]) then Double.NaN else sumf / len;
    def out  = CompoundValue(1, (src * wei + out[1] * (len - wei)) / len, ma);
    plot return = out;
}


#----Div-----------
input ShowLastDivLines = yes;
input DivBull = yes;      # "Plot Bullish"
input DivBear = yes;      # "Plot Bearish"
input PivotLookbackRight = 5;  # "Pivot Lookback Right"
input PivotLookbackLeft  = 10; # "Pivot Lookback Left"
input MaxLookback = 60;   # "Max of Lookback Range"
input MinLookback = 5;    # "Min of Lookback Range"

def divSrc = fundtrend;
def maxx = Max(fundtrend, bullbearline);
def minn = Min(fundtrend, bullbearline);

script FindPivots {
    input dat = close; # default data or study being evaluated
    input HL  = 0;    # default high or low pivot designation, -1 low, +1 high
    input lbL  = 5;    # default Pivot Lookback Left
    input lbR  = 1;    # default Pivot Lookback Right
    ##############
    def _nan;    # used for non-number returns
    def _BN;     # the current barnumber
    def _VStop;  # confirms that the lookforward period continues the pivot trend
    def _V;      # the Value at the actual pivot point
    ##############
    _BN  = BarNumber();
    _nan = Double.NaN;
    _VStop = if !IsNaN(dat) and lbR > 0 and lbL > 0 then
                fold a = 1 to lbR + 1 with b=1 while b do
                    if HL > 0 then dat > GetValue(dat, -a) else dat < GetValue(dat, -a) else _nan;
    if (HL > 0) {
        _V = if _BN > lbL + 1 and dat == Highest(dat, lbL + 1) and _VStop
            then dat else _nan;
    } else {
        _V = if _BN > lbL + 1 and dat == Lowest(dat, lbL + 1) and _VStop
            then dat else _nan;
    }
    plot result = if !IsNaN(_V) and _VStop then _V else _nan;
}
#_inRange(cond) =>
script _inRange {
    input cond = yes;
    input rangeUpper = 60;
    input rangeLower = 5;
    def bars = if cond then 0 else bars[1] + 1;
    def inrange =  (rangeLower <= bars) and (bars <= rangeUpper);
    plot retrun = inrange;
}
def pl_ = findpivots(divSrc, -1, PivotLookbackLeft, PivotLookbackRight);
def ph_ = findpivots(divSrc, 1, PivotLookbackLeft, PivotLookbackRight);
def pl = !IsNaN(pl_);
def ph = !IsNaN(ph_);
def pll = Lowest(divSrc, PivotLookbackLeft + 1);
def phh = Highest(divSrc, PivotLookbackLeft + 1);
def sll = Lowest(l, PivotLookbackLeft + 1);
def shh = Highest(h, PivotLookbackLeft + 1);
#-- Pvt Low
def plStart  = if pl then yes else plStart[1];
def plFound  = if (plStart and pl) then 1 else 0;
def vlFound1 = if plFound then divSrc else vlFound1[1];
def vlFound_ = if vlFound1 != vlFound1[1] then vlFound1[1] else vlFound_[1];
def vlFound  = if !vlFound_ then pll else vlFound_;
def plPrice1 = if plFound then l else plPrice1[1];
def plPrice_ = if plPrice1 != plPrice1[1] then plPrice1[1] else plPrice_[1];
def plPrice  = if !plPrice_ then sll else plPrice_;
#-- Pvt High
def phStart = if ph then yes else phStart[1];
def phFound = if (phStart and ph) then 1 else 0;
def vhFound1 = if phFound then divSrc else vhFound1[1];
def vhFound_ = if vhFound1 != vhFound1[1] then vhFound1[1] else vhFound_[1];
def vhFound = if !vhFound_ then phh else vhFound_;
def phPrice1 = if phFound then h else phPrice1[1];
def phPrice_ = if phPrice1 != phPrice1[1] then phPrice1[1] else phPrice_[1];
def phPrice = if !phPrice_ then shh else phPrice_;
#// Regular Bullish
def inRangePl = _inRange(plFound[1], MaxLookback, MinLookback);
def oscHL = divSrc > vlFound and inRangePl;
def priceLL = l < plPrice and divSrc <= 40;
def bullCond = plFound and oscHL and priceLL;

#// Regular Bearish
def inRangePh = _inRange(phFound[1], MaxLookback, MinLookback);
def oscLH   = divSrc < vhFound and inRangePh;
def priceHH = h > phPrice and divSrc >= 60;
def bearCond = phFound and oscLH and priceHH;

#------ Bubbles
def bullBub  = DivBull and bullCond;
def bearBub  = DivBear and bearCond;

AddChartBubble(bullBub, minn, "R", Color.CYAN, no);
AddChartBubble(bearBub, maxx, "R", CreateColor(176, 39, 176), yes);
alert(bullBub, "LONG" ,alert.BAR, sound.Ding);
alert(bearBub, "SHORT" ,alert.BAR, sound.Ring);


##### Lines
def bar = BarNumber();
#-- Bear Line
def lastPhBar = if ph then bar else lastPhBar[1];
def prePhBar = if lastPhBar != lastPhBar[1] then lastPhBar[1] else prePhBar[1];
def priorPHBar = if bearCond then prePhBar else priorPHBar[1];
#-- Bull Line
def lastPlBar = if pl then bar else lastPlBar[1];
def prePlBar = if lastPlBar != lastPlBar[1] then lastPlBar[1] else prePlBar[1];
def priorPLBar = if bullCond then prePlBar else priorPLBar[1];

def lastBullBar = if bullCond then bar else lastBullBar[1];
def lastBearBar = if bearCond then bar else lastBearBar[1];

def hiStart = bar == HighestAll(priorPHBar);
def hiEnd   = bar == HighestAll(lastBearBar);
def loStart = bar == HighestAll(priorPLBar);
def loEnd   = bar == HighestAll(lastBullBar);

def pivotHigh = if hiStart then maxx else if hiEnd then maxx else na;#if HighPivots then bullbearline else na;
def pivotLow  = if loStart then minn else if loEnd then minn else na;

plot PlotHline = if ShowLastDivLines then pivotHigh else na;
PlotHline.EnableApproximation();
PlotHline.SetDefaultColor(Color.MAGENTA);
PlotHline.SetPaintingStrategy(PaintingStrategy.LINE_VS_POINTS);
PlotHline.setlineweight(1);

plot PlotLline = if ShowLastDivLines then pivotLow else na;
PlotLline.EnableApproximation();
PlotLline.SetDefaultColor(Color.CYAN);
PlotLline.SetPaintingStrategy(PaintingStrategy.LINE_VS_POINTS);
PlotLline.setlineweight(1);


