Know Sure Thing (KST) Indicator for ThinkorSwim

Likos

Member
2019 Donor
I'd love to test this out, unless there exists one already ?

Code:
# KNOWSURETHING
# DREWGRIFFITH15 (C) 2014

declare lower;

input RC1_LEN = 5;
input RC1_SMA = 10;
input RC2_LEN = 5;
input RC2_SMA = 15;
input RC3_LEN = 5;
input RC3_SMA = 20;
input RC4_LEN = 5;
input RC4_SMA = 25;
input KST_SMA = 5;
input FILTER = 0.30; # SIZE of MOVEMENT
input price = close;

DEF RC1 = if price[RC1_LEN] > 0 then (price / price[RC1_LEN] - 1) * 100 else 0;
DEF RC2 = if price[RC2_LEN] > 0 then (price / price[RC2_LEN] - 1) * 100 else 0;
DEF RC3 = if price[RC3_LEN] > 0 then (price / price[RC3_LEN] - 1) * 100 else 0;
DEF RC4 = if price[RC4_LEN] > 0 then (price / price[RC4_LEN] - 1) * 100 else 0;

DEF RCMA1 = SIMPLEMOVINGAVG(RC1,RC1_SMA);
DEF RCMA2 = SIMPLEMOVINGAVG(RC2,RC2_SMA);
DEF RCMA3 = SIMPLEMOVINGAVG(RC3,RC3_SMA);
DEF RCMA4 = SIMPLEMOVINGAVG(RC4,RC4_SMA);

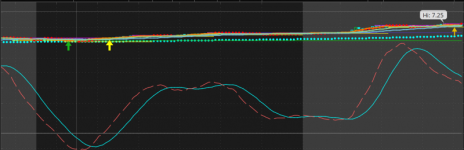
PLOT KST = (RCMA1 * 1) + (RCMA2 * 2) + (RCMA3 * 3) + (RCMA4 * 4);

PLOT SignalLine = SIMPLEMOVINGAVG(KST,9);

PLOT ZeroLine = 0;

PLOT RATING =
IF KST > SignalLine AND KST[1] < SignalLine[1] AND ROUND(KST-KST[1],2) >= FILTER THEN ROUND(KST-KST[1],2)
ELSE IF KST < SignalLine AND KST[1] > SignalLine[1] AND ROUND(KST-KST[1],2) <= -FILTER THEN ROUND(KST-KST[1],2)
#ELSE IF KST > ZeroLine AND KST[1] < ZeroLine AND ROUND(KST-KST[1],2) >= FILTER THEN ROUND(KST-KST[1],2)
#ELSE IF KST < ZeroLine AND KST[1] > ZeroLine AND ROUND(KST-KST[1],2) <= -FILTER THEN ROUND(KST-KST[1],2)
ELSE 0;

KST.SETDEFAULTCOLOR(COLOR.MAGENTA);
SignalLine.SETDEFAULTCOLOR(COLOR.CYAN);
ZeroLine.SETDEFAULTCOLOR(COLOR.DARK_GRAY);
RATING.HIDE();
RATING.HIDEBUBBLE();
 
Last edited:

Join useThinkScript to post your question to a community of 21,000+ developers and traders.

@Likos


Rich (BB code):
# Martin Pring's KNOW SURE THING (KST) Indicator 

# Daily KST Simple Moving Average 

# Writen by Mike Wilgus 

# fxmike.blogspot.com 

# ------------------------------------------------ 

declare lower; 


#--Input variables 

input rocLength1 = 10; 

input rocLength2 = 15; 

input rocLength3 = 20; 

input rocLength4 = 30; 


def sumRocLength = rocLength1+rocLength2+rocLength3+rocLength4; 

def avgLength1 = 10; 

def avgLength2 = 10; 

def avgLength3 = 10; 

def avgLength4 = 15; 


#--Calc ROC - RateOfChange(length, color norm length, price) 

def ROC1 = RateOfChange(rocLength1, rocLength1, close); 

def ROC2 = RateOfChange(rocLength2, rocLength2, close); 

def ROC3 = RateOfChange(rocLength3, rocLength3, close); 

def ROC4 = RateOfChange(rocLength4, rocLength4, close); 


#--Plot lines 

plot zeroLine = 0; 


plot fastKST = (Average(ROC1,avgLength1)*(rocLength1/sumRocLength))+ 

               (Average(ROC2,avgLength2)*(rocLength2/sumRocLength))+ 

               (Average(ROC3,avgLength3)*(rocLength3/sumRocLength))+ 

               (Average(ROC4,avgLength4)*(rocLength4/sumRocLength)); 


plot slowKST = Average(fastKST,rocLength1); 


#--Set Colors and Style 

zeroLine.SetDefaultColor(GetColor(7)); 

fastKST.SetDefaultColor(GetColor(5)); 

fastKST.SetStyle(Curve.LONG_DASH); 

slowKST.SetDefaultColor(GetColor(1)); 


#--End Code--------------------------------------
 
Last edited by a moderator:
@Gildes This is amazing but... it's all smooshed together &#128513;
7erPsYh.png


Attachments

  • 7erPsYh.png
    7erPsYh.png
    121.5 KB · Views: 81
Last edited:
pGRJBlI.png


Hi, found a similar post from patternsmart.com on KST, i noticed that between their setting and the script posted earlier, they have included the SMA length eg sma length 5,5,5,10 in their indicator? May i know if that is necessary if so can anyone advise how to insert them into the script posted earlier?

Thank you


Attachments

  • pGRJBlI.png
    pGRJBlI.png
    56.9 KB · Views: 88
Last edited:
@Nick Not sure where those inputs came from but the Know Sure Thing indicator shared above looks correct. It could be more of a preference on the moving averages.

 
Last edited:
Rich (BB code):
#Dilbert_KnownSureThing  (AKA KST) 

# V1  -  122015  - Dilbert      - 1st code cut 


#13:23 dilbert: For those of you that just need 1 more moving average study where is 1 applied to the RateOfChange study. 


declare lower; 


input length1 = 10; 

input length2 = 15; 

input length3 = 20; 

input length4 = 30; 

input SMA1L = 10; 

input SMA2L = 10; 

input SMA3L = 10; 

input SMA4L = 15; 

input price = close; 

input SignalLength = 9; 

assert(length1 > 0, "'length' must be positive: " + length1); 

assert(length2 > 0, "'length' must be positive: " + length2); 

assert(length3 > 0, "'length' must be positive: " + length3); 

assert(length4 > 0, "'length' must be positive: " + length4); 


def ROC1 = if price[length1] != 0 then (price / price[length1] - 1) * 100 else 0; 

def ROC2 = if price[length2] != 0 then (price / price[length2] - 1) * 100 else 0; 

def ROC3 = if price[length3] != 0 then (price / price[length3] - 1) * 100 else 0; 

def ROC4 = if price[length4] != 0 then (price / price[length4] - 1) * 100 else 0; 


def SMA1 = SimpleMovingAvg(price,10,0); 

def SMA2 = SimpleMovingAvg(price,10,0); 

def SMA3 = SimpleMovingAvg(price,10,0); 

def SMA4 = SimpleMovingAvg(price,15,0); 


plot KST = (SMA1 * 1) + (SMA2 * 2) + (SMA3 * 3) + (SMA4 * 4); 


plot SignalLine = SimpleMovingAvg(KST,SignalLength,0); 

KST.SetDefaultColor(Color.Green); 

SignalLine.SetDefaultColor(Color.Red); 


plot BullCross = if KST crosses above SignalLine then 1 else 0; 

plot BearCross = if KST crosses below SignalLine then 1 else 0; 

plot Bullish = if KST > SignalLine then 1 else 0; 

plot Bearish = if KST < SignalLine then 1 else 0; 


BullCross.Hide(); 

BearCross.Hide(); 

Bullish.Hide(); 

Bearish.Hide(); 


# End Study

There are a number of KST Indicators floating around.

This just showed up in the OneNote today.

The OneNote is pinned to the top of this excellent resource, thanks to @BenTen!

 
Last edited by a moderator:
@GeneHo For alert, add this code to the bottom of the indicator:

Rich (BB code):
Alert(fastKST[1] < slowKST[1] and fastKST > slowKST, "Cross Above", Alert.BAR, Sound.RING);
Alert(fastKST[1] > slowKST[1] and fastKST < slowKST, "Cross Below", Alert.BAR, Sound.RING);
 
Last edited:
Here is another Know Sure Thing indicator that somebody shared with me. It has different values and simple moving averages. It also has alerts as well.

Rich (BB code):
# ------------------------------------------------
declare lower;

#--Input variables
input rocLength1 = 17;
input rocLength2 = 12;
input rocLength3 = 20;
input rocLength4 = 25;

def sumRocLength = rocLength1+rocLength2+rocLength3+rocLength4;
input smaLength1 = 6;
input smaLength2 = 5;
input smaLength3 = 1;
input smaLength4 = 1;
input signal_length=8;
def ROC1 = RateOfChange(rocLength1, rocLength1, close);
def ROC2 = RateOfChange(rocLength2, rocLength2, close);
def ROC3 = RateOfChange(rocLength3, rocLength3, close);
def ROC4 = RateOfChange(rocLength4, rocLength4, close);

plot zeroLine = 0;
 
def RCMA1 =  Average(ROC1,smaLength1);
def RCMA2 =  Average(ROC2,smaLength2);
def RCMA3 =  Average(ROC3,smaLength3);
def RCMA4 =  Average(ROC4,smaLength4);

plot KST = (RCMA1* 1) + (RCMA2* 2) + (RCMA3* 3) + (RCMA4 * 4);

plot Signal_Line = Average(kst, signal_length);

KST.SetDefaultColor(Color.Lime);

Signal_Line.SetDefaultColor(Color.CYAN);

Alert(KST crosses above zeroline, "", Alert.BAR, Sound.Bell);

Alert(KST crosses above Signal_Line, "", Alert.BAR, Sound.Ding);

#--End Code--------------------------------------

Shareable Link: https://tos.mx/f8OI5K

 
Last edited:
Hi
I am aware of the alert that we can incorporate to study, just thinking if it is possible that we can scan our watchlist and get the scan list of those stock what has is a crossover of KST and signal line?
Thanks
 
Hi
I am aware of the alert that we can incorporate to study, just thinking if it is possible that we can scan our watchlist and get the scan list of those stock what has is a crossover of KST and signal line?
Thanks
Sure, please go the Tutorial on How to Run the Scanner. Read through that and see the two videos.
After that, you should have no problem building it.
 
Could this KST Indicator be coded to Show a Label Study on the Upper Chart for the time frame but also have a multi time frame label showing the larger time frames? I'd like it to show a Green Label when the KST is ABOVE the EMA and Red when below, and maybe dark green when above but below the zero line and bright green when above both the average line and above the zero line? similar for the red conditions.

This KST Indicator is one of th emost consistent averages whentrading futures onall time frames.
 
Last edited:

Not the exact question you're looking for?

Start a new thread and receive assistance from our community.

87k+ Posts
485 Online
Create Post

The Market Trading Game Changer

Join 2,500+ subscribers inside the useThinkScript VIP Membership Club
  • Exclusive indicators
  • Proven strategies & setups
  • Private Discord community
  • ‘Buy The Dip’ signal alerts
  • Exclusive members-only content
  • Add-ons and resources
  • 1 full year of unlimited support

Frequently Asked Questions

What is useThinkScript?

useThinkScript is the #1 community of stock market investors using indicators and other tools to power their trading strategies. Traders of all skill levels use our forums to learn about scripting and indicators, help each other, and discover new ways to gain an edge in the markets.

How do I get started?

We get it. Our forum can be intimidating, if not overwhelming. With thousands of topics, tens of thousands of posts, our community has created an incredibly deep knowledge base for stock traders. No one can ever exhaust every resource provided on our site.

If you are new, or just looking for guidance, here are some helpful links to get you started.

What are the benefits of VIP Membership?
VIP members get exclusive access to these proven and tested premium indicators: Buy the Dip, Advanced Market Moves 2.0, Take Profit, and Volatility Trading Range. In addition, VIP members get access to over 50 VIP-only custom indicators, add-ons, and strategies, private VIP-only forums, private Discord channel to discuss trades and strategies in real-time, customer support, trade alerts, and much more. Learn all about VIP membership here.
How can I access the premium indicators?
To access the premium indicators, which are plug and play ready, sign up for VIP membership here.
Back
Top