
Author Message:
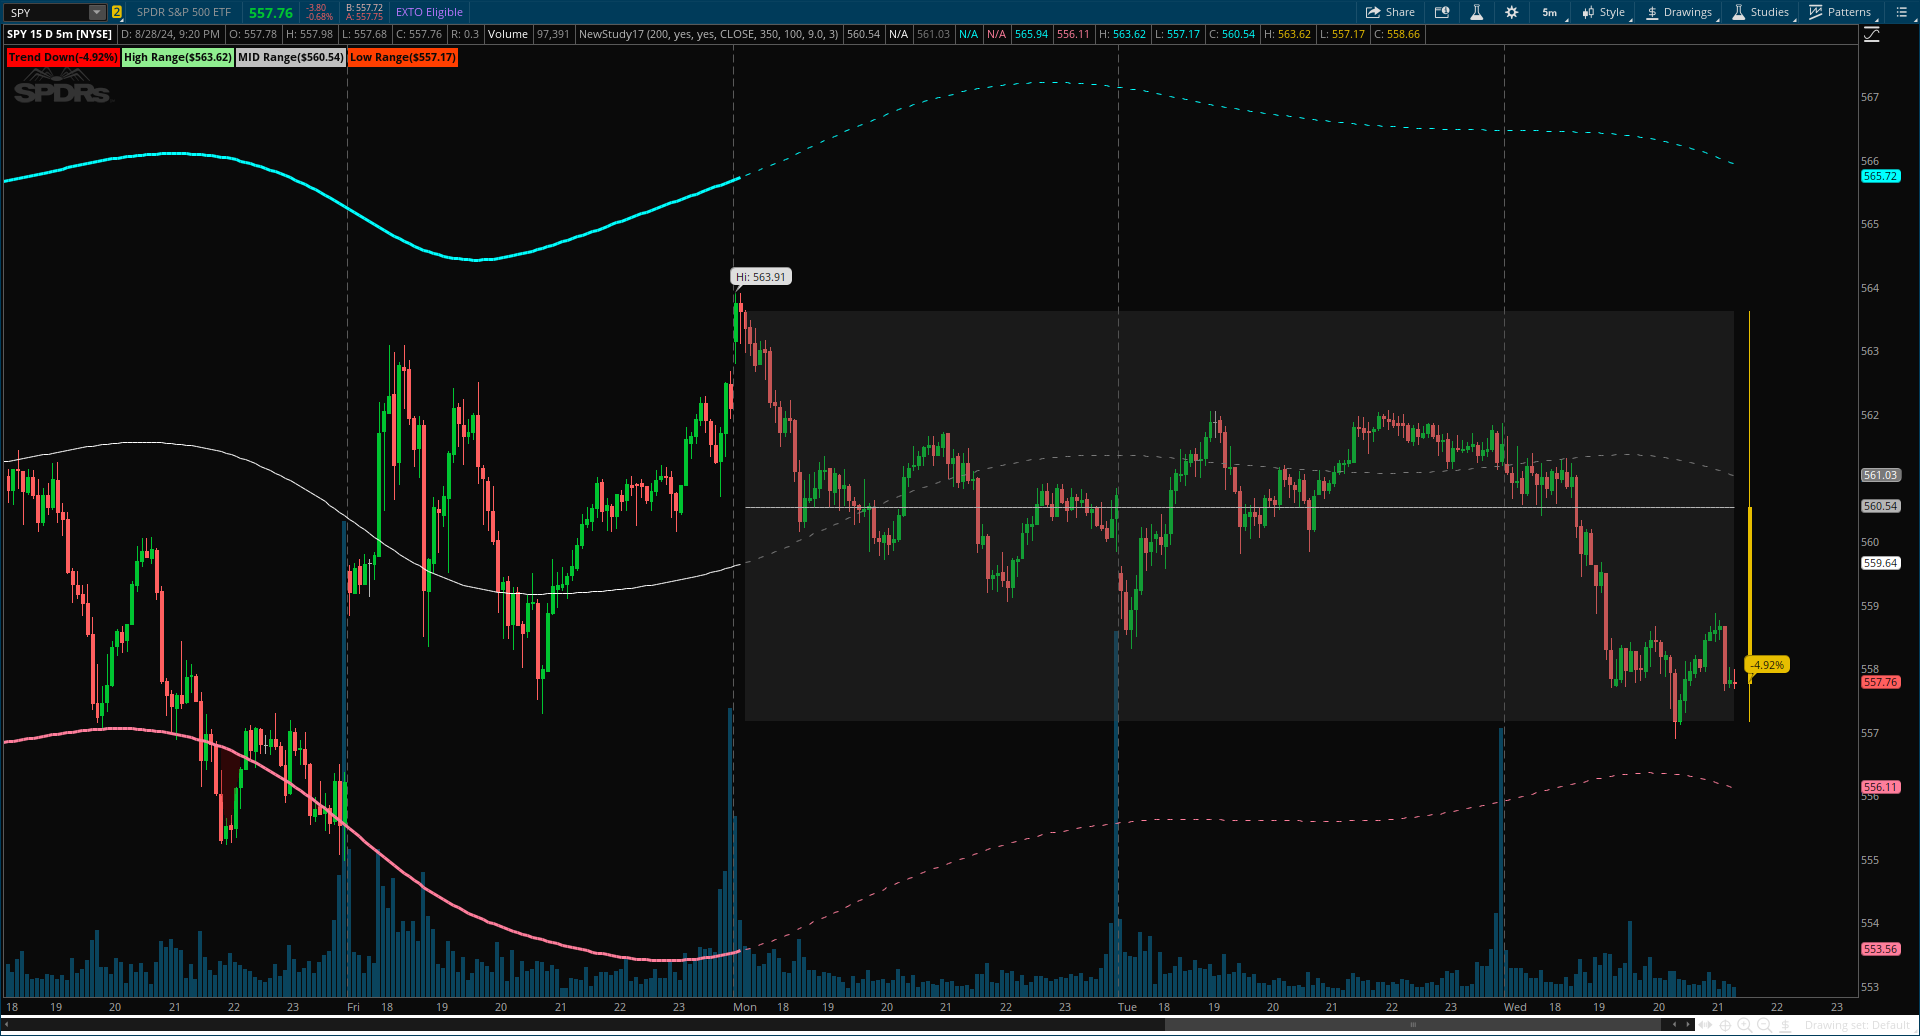
The Jurik Price Bands and Range Box - BigBeluga indicator is an advanced technical analysis tool that combines Jurik Moving Average (JMA) based price bands with a dynamic range box. This versatile indicator is designed to help traders identify trends, potential reversal points, and price ranges over a specified period.
CODE:
CSS:
#// Indicator for TOS
#// © BigBeluga
#indicator("Jurik Price Bands and Range Box [BigBeluga]", overlay=true)
# Converted by Sam4Cok@Samer800    - 08/2024

input RangeBoxLength = 200;           # "Range Box Length"
input AdaptiveMidRange = yes;         # "Adaptive Mid Range"
input showJurikBands = yes;
input bandSource = close;
input bandLength     = 350;               # "Length"
input phase      = 100;
input deviationMulti  = 9.0; #, "Deviation", group = "Macro Bands")

def na = Double.NaN;
def last = IsNaN(close);
def isintraday = GetAggregationPeriod() < AggregationPeriod.DAY;
#/—— Calculations
#//@function Calculates Jurik Moving Average
script jma {
    input src = close;
    input len = 350;
    input ph = 100;
    def jma;
    def jma1 = CompoundValue(1, if IsNaN(jma[1]) then 0 else jma[1], 0);
    def phaseRatio = if ph < -100 then 0.5 else
                     if ph > 100 then 2.5 else ph / 100 + 1.5;
    def beta = 0.45 * (len - 1) / (0.45 * (len - 1) + 2);
    def alpha = Power(beta, phaseRatio);
    def e0 = (1 - alpha) * src + alpha * e0[1];
    def e1 = (src - e0) * (1 - beta) + beta * e1[1];
    def e2 = (e0 + phaseRatio * e1 - jma1) * Power(1 - alpha, 2) + Power(alpha, 2) * e2[1];
    jma = e2 + jma1;
    plot out = jma;
}
#// Calculate smooth price using Jurik MA
def smooth_price = jma(bandSource, bandLength, phase);
#// Calculate range using Jurik MA on ATR
def nATR = ATR(Length = 200);
def range_ = jma(nATR, 200, phase) * deviationMulti;
#// Calculate upper and lower bands
def upper_band = smooth_price + range_;
def lower_band = smooth_price - range_;
#// Calculate high, low, and mid prices from the historical array
def h = Highest(bandSource, RangeBoxLength+1);
def l = Lowest(bandSource, RangeBoxLength+1);
def hl = (h + l) / 2;
def m = if AdaptiveMidRange then Average(close, RangeBoxLength) else hl;
def ml = inertiaAll(highestAll(inertiaAll(m, 2)), RangeBoxLength + 1);
def hh = inertiaAll(highestAll(inertiaAll(h, 2)), RangeBoxLength + 1);
def ll = inertiaAll(highestAll(inertiaAll(l, 2)), RangeBoxLength + 1);
def extML = if !isNaN(ml) then ml else extML[1];
def extHi = if !isNaN(hh) then hh else extHi[1];
def extLo = if !isNaN(ll) then ll else extLo[1];
def MLval = if extML then extML else na;
def HiVal = if extHi then extHi else na;
def LoVal = if extLo then extLo else na;
#// Calculate percentage difference and mid price
def diff  = (close - extML) / close * (if isintraday then 1000 else 100);
def mid   = (close + extML) /2;
#// Determine colors based on price position
def col = close > extML;

#/plotting
#// Plot Jurik bands and smooth price with fills at extreams
plot avgLine = if !last and extML then extML else na;
plot SmoothPrice = if showJurikBands and isNaN(ml) then smooth_price else na; # "Smooth Price"
plot SmoothPrice1 = if showJurikBands and ml then smooth_price else na;       # "Smooth Price"
plot up = if showJurikBands and isNaN(hh) then upper_band else na;     # "Upper Band"
plot lw = if showJurikBands and isNaN(ll) then lower_band else na;     # "Lower Band"
plot up1 = if showJurikBands and !isNaN(hh) then upper_band else na;     # "Upper Band"
plot lw1 = if showJurikBands and !isNaN(ll) then lower_band else na;     # "Lower Band"
avgLine.SetDefaultColor(GetColor(3));
SmoothPrice1.SetStyle(Curve.SHORT_DASH);
up1.SetStyle(Curve.SHORT_DASH);
lw1.SetStyle(Curve.SHORT_DASH);
SmoothPrice.SetDefaultColor(GetColor(9));
SmoothPrice1.SetDefaultColor(GetColor(7));
up.SetDefaultColor(GetColor(1));
lw.SetDefaultColor(GetColor(2));
up.SetLineWeight(3);
lw.SetLineWeight(3);
up1.SetDefaultColor(GetColor(1));
lw1.SetDefaultColor(GetColor(2));


# Plot the new Chart
input candleOffset = 3;
def n = candleOffset;
def loc = last[n-1] and !last[n];
def rndDiff = Round(diff, 2);
AddChart(open = if loc and diff[n]>0 then close[n] else na, high = HiVal[n] , low = LoVal[n] , close = MLval[n],
         type = ChartType.CANDLE, growcolor = GetColor(1));

AddChart(open = if loc and diff[n]<0 then MLval[n] else na, high = HiVal[n] , low = LoVal[n] , close = close[n],
         type = ChartType.CANDLE, growcolor =  GetColor(4));

#-- Bubble
def locLab = close[n] + AbsValue(close[n] - MLval[n]) / 2;
AddChartBubble(loc, close[n], rndDiff[n] + "%", if diff[n]>0 then GetColor(1) else GetColor(4));

#HiVal[n+1]
#-- Clouds
def maxx = Max(open, close);
def minn = Min(open, close);
AddCloud(hh, ll, Color.DARK_GRAY);

AddCloud(if minn>=up then minn else na , up, Color.DARK_GREEN);
AddCloud(if maxx<=lw then lw else na, maxx, Color.DARK_RED);


#-- Labels
AddLabel(!last, (if col then "Trend Up(" else "Trend Down(") + AsPercent(rndDiff/100) + ")",
         if col then Color.GREEN else Color.RED);
AddLabel(!last, "High Range(" + asDollars(extHi) + ")", Color.LIGHT_GREEN);
AddLabel(!last, "MID Range(" + asDollars(extML) + ")", Color.LIGHT_GRAY);
AddLabel(!last, "Low Range(" + asDollars(LoVal) + ")", Color.LIGHT_RED);


#-- END of CODE