Author states: The VIX (Cboe Volatility Index) is a widely-followed measure of stock market volatility.
JPMorgan strategists, led by Mislav Matejka, have developed an indicator based on the VIX that could be used to trade the markets more effectively.
The concept is simple:
Every single time, the S&P 500 Index increased by an average of 9% over the ensuing six months.

Thought I'd share. On a different thinkscript resource they discussed this VIX strategy that was "100%" accurate at the time. I don't know if it's still true but....
https://thinkscript101.com/vix-buy-signal-indicator-for-thinkorswim/
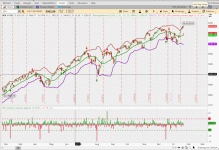
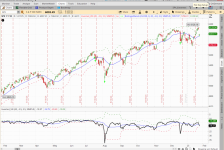
It did look interesting though. So I added it to my custom indicators and then modified it a bit to show up on my charts. I copied the bubble structure from the Highest Volume of the Year indicator by XeoNoX via usethinkscript.com and added the fabulous Bubble Mover code. It does look like a very good way to show when the VIX hits inflection.
JPMorgan strategists, led by Mislav Matejka, have developed an indicator based on the VIX that could be used to trade the markets more effectively.
The concept is simple:
The VIX Buy Signal indicator has been triggered more than 21 times during the past 30 years.A buy signal is generated when the VIX increases by more than 50% of its 1-month moving average.
Every single time, the S&P 500 Index increased by an average of 9% over the ensuing six months.

Thought I'd share. On a different thinkscript resource they discussed this VIX strategy that was "100%" accurate at the time. I don't know if it's still true but....
https://thinkscript101.com/vix-buy-signal-indicator-for-thinkorswim/
It did look interesting though. So I added it to my custom indicators and then modified it a bit to show up on my charts. I copied the bubble structure from the Highest Volume of the Year indicator by XeoNoX via usethinkscript.com and added the fabulous Bubble Mover code. It does look like a very good way to show when the VIX hits inflection.
Code:
####
# Indicator Name: JPMorgan’s VIX Buy Signal
# Description: A bullish indicator from JPMorgan strategists
# Version: 1.0.0
# Developer: Melvin C.
# URL: https://thinkscript101.com/vix-buy-signal-indicator-for-thinkorswim/
####

declare lower;
def vix_data = close("VIX");
plot vix_average = (vix_data / average(vix_data, 30));
plot signal_line = 1.5;
vix_average.SetPaintingStrategy(PaintingStrategy.HISTOGRAM);

# END original VIX_JPMorganBuySignal_Lower code

# below is Stuff I added to to show bubbles and labels (if desired) and to allow user to ONLY show the histogram lines if the condition is met by making ONLY vix_average2 show and marking the rest to no show in the settings.  I'm not an expert thinkscript coder so most of this is cobbled together from other snippets of code I copied and pasted and then manipulated.

def vix_average1 = (if vix_average > 1.5 then vix_average else 0);
plot vix_average2 = (vix_average1 );
addlabel(yes,if vix_average >= signal_line then "JPMorgan VixBuy" else "",color.black);
vix_average2.SetPaintingStrategy(PaintingStrategy.HISTOGRAM);

input labels = yes;
def VixBubble = vix_average >= signal_line;
def yearhighvol = HighestAll(if GetLastYear() == GetYear() and !IsNaN(close) and !IsNaN(close[-1]) then VixBubble else 0);

def himonth = if VixBubble==1 then getmonth() else himonth[1];
def hiday =   if VixBubble==1 then getDayOfMonth(getYYYYMMDD()) else hiday[1];
def hiyear  = if VixBubble==1 then getyear() else hiyear[1];

AddLabel (labels, "VIX_JPM BuySig : " + himonth + "/" + hiday + "/" + hiyear, Color.black);

def BubbleHighest = VixBubble==yearhighvol;
input bubblemoversideways = -1;
def b  = bubblemoversideways;
def b1 = b + 1;
input bubblemoverupdown   = 0.50;

AddChartBubble(BubbleHighest ,VixBubble * bubblemoverupdown, "JPM " +himonth+" " + hiday,  Color.YELLOW, yes);
Last edited by a moderator:


