Is there a way to pull HLC array into thinkscript?

Qbtrades

New member
VIP
I am wanting to be able to find things like the median of the high, low, close array (all HLC prices in the same array) for the past xx amount of days. Or is there a way around it? Finding the median for each individual one or HLC3 is not the same. Thanks!
 
Solution
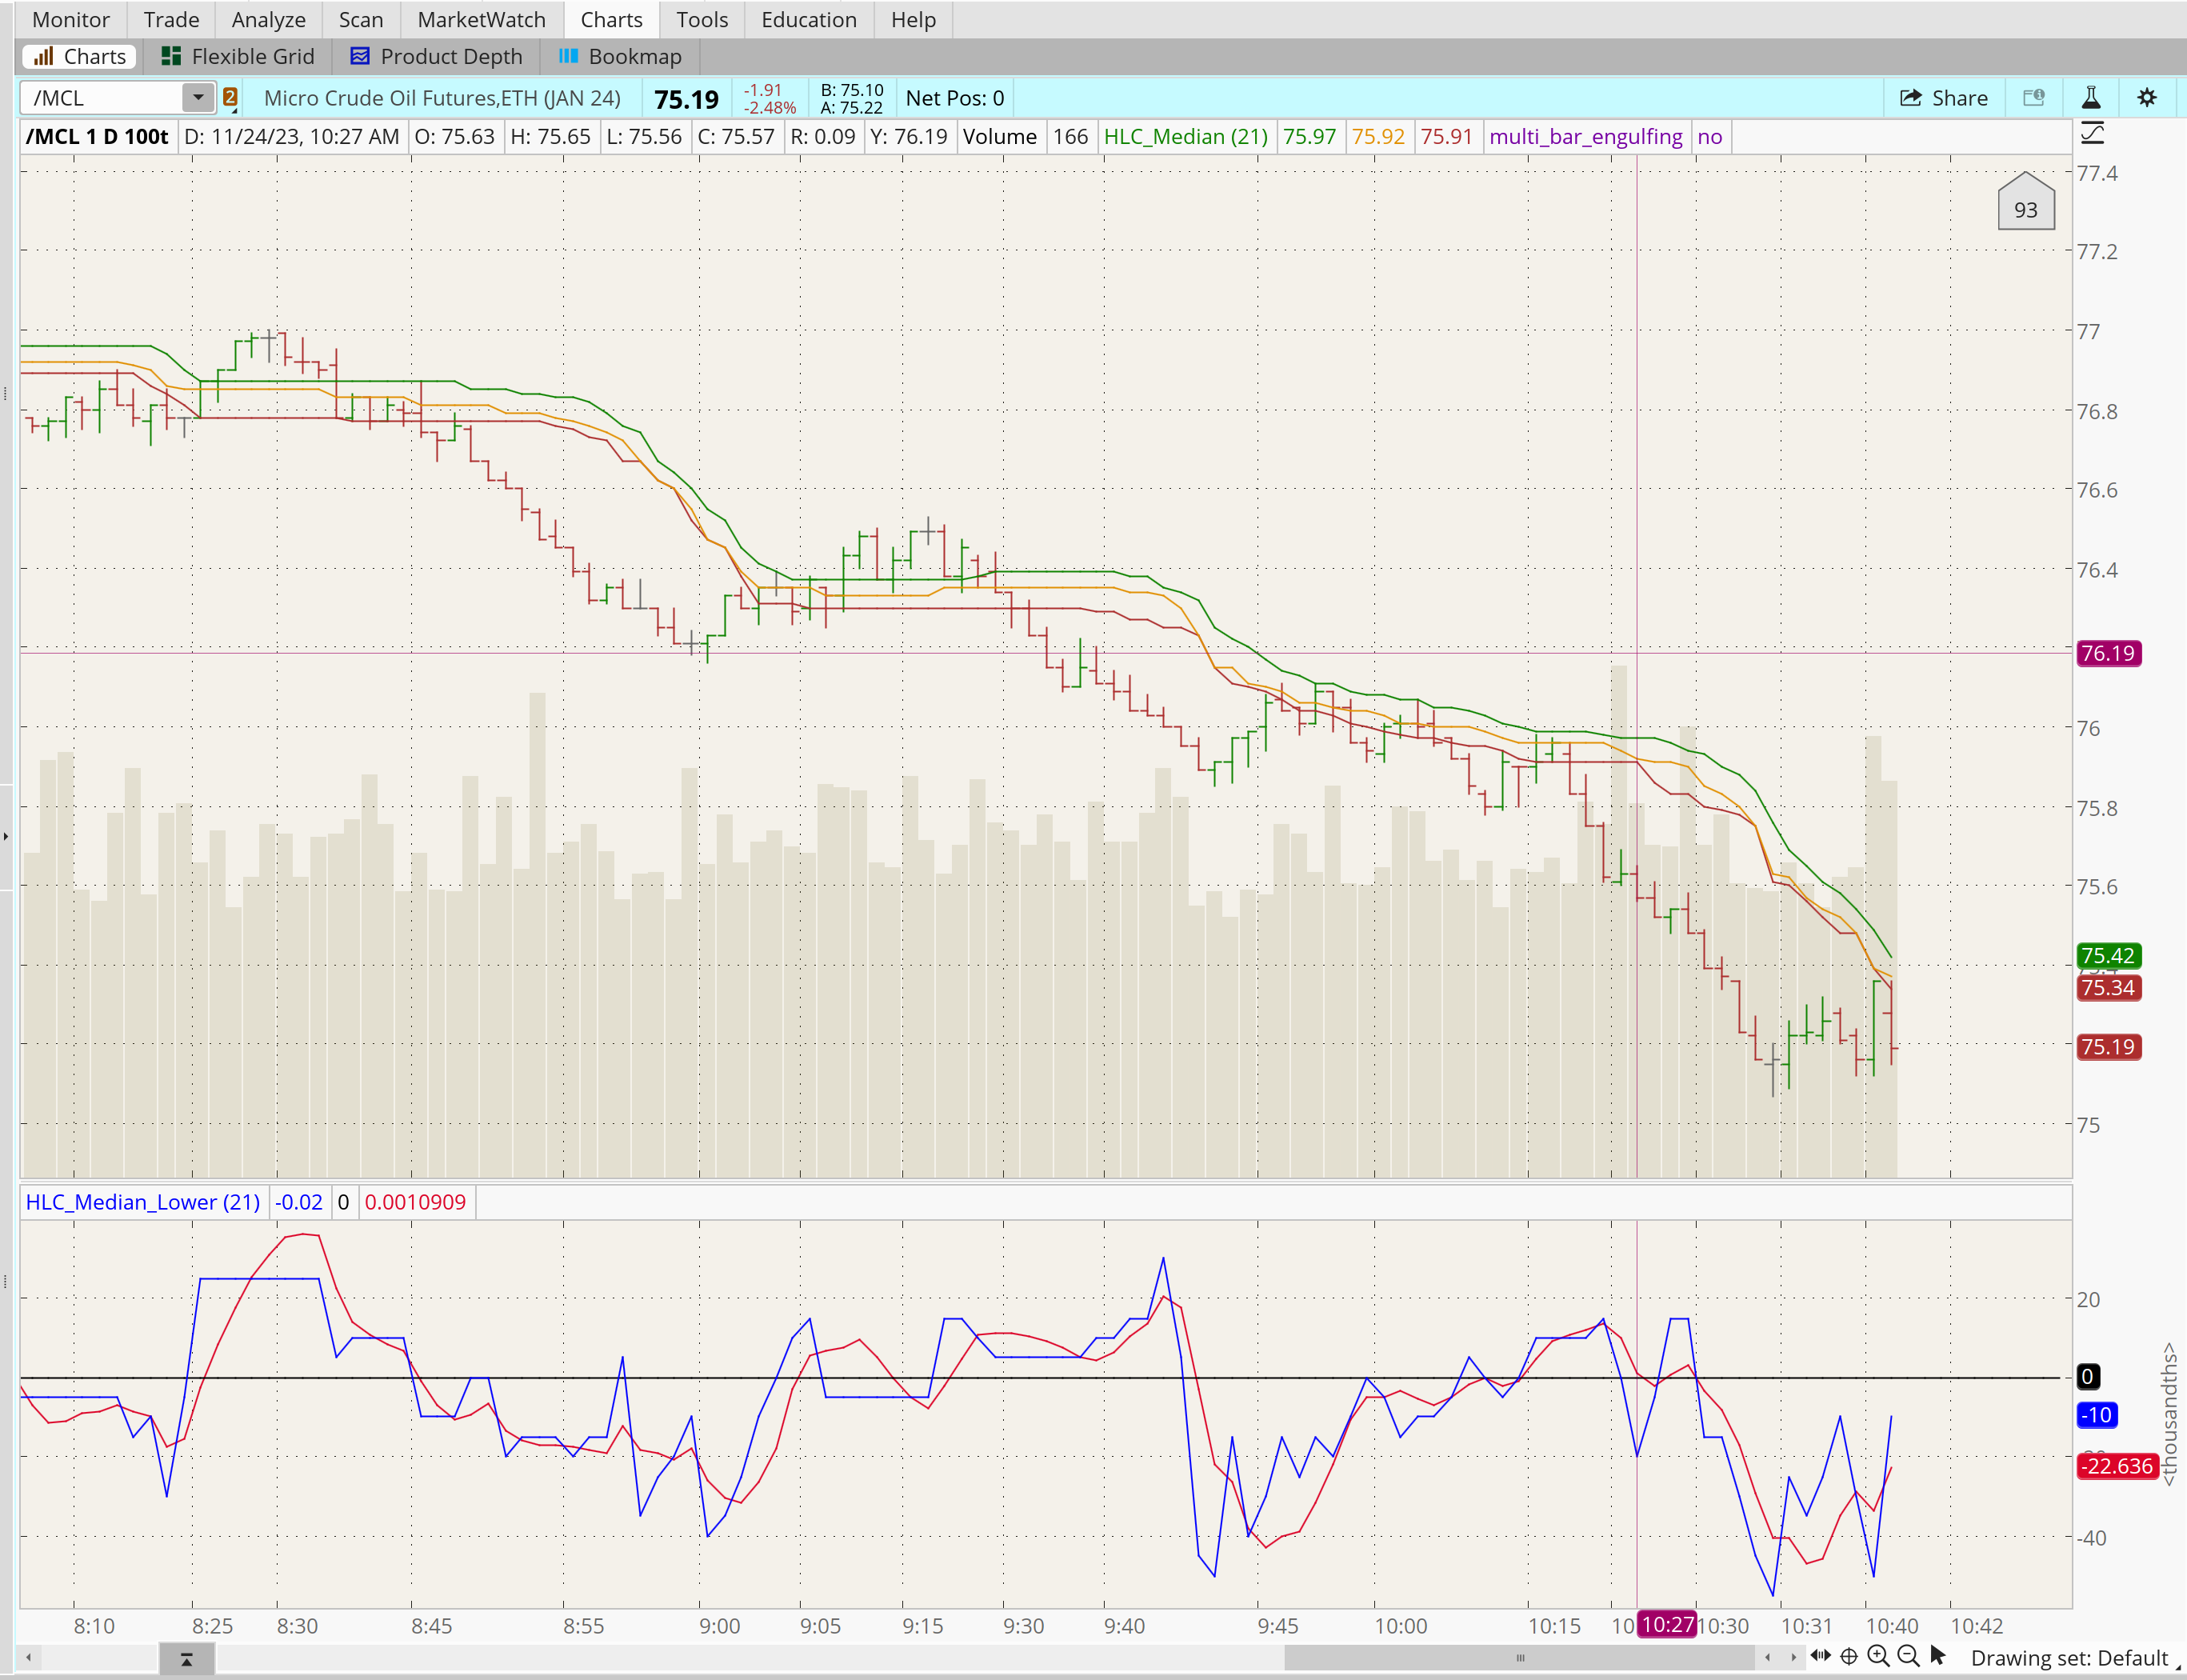
So. After looking again at ThinkScript help, I discovered that at some point they added a MEDIAN() function. So here's some code...

Code:
declare upper;

input length = 15;

plot high_med = Median(high, length);
plot close_med = Median(close, length);
plot low_med = Median(low, length);

and a somewhat interesting lower to go with it:
Code:
declare lower;

input length = 15;

def high_med = Median(high, length);
def close_med = Median(close, length);
def low_med = Median(low, length);

def midline = (high_med + low_med) / 2;
plot moving = close_med - midline;
plot zero = 0;

plot average = inertia(moving, floor(length / 2));
This looks at the position of the close in the channel formed by the high and low median prices. When it is...
ThinkScript does not, to the best of my knowledge, have any way to sort arrays of values, and so finding the median from any list is beyond the abilities of the code. If you don't mind doing your analysis outside of ToS, there are some threads about exporting OHLCV data from ThinkOrSwim. From there, you can do analysis in Excel or OpenOffice etc...

-mashume
 
I am wanting to be able to find things like the median of the high, low, close array (all HLC prices in the same array) for the past xx amount of days. Or is there a way around it? Finding the median for each individual one or HLC3 is not the same. Thanks!

i'm not quite following what you are wanting to do, how to look at/sort 3 variables,
but i did make a sorting study that might help.
https://usethinkscript.com/threads/rank-volume-1-10.9504/#post-108403

it sorts data in 1 variable.
can pick how many bars to sort, up to all the bars on a chart.
looks at the last x bars on the chart.

default sort data is close, from smallest to largest.
def data = close;

green bubbles show the ranking number,
rank3

yellow bubbles show the sorted data, smallest to big
cntup_in_rng - rank #
data_rank - data
 
So. After looking again at ThinkScript help, I discovered that at some point they added a MEDIAN() function. So here's some code...

Code:
declare upper;

input length = 15;

plot high_med = Median(high, length);
plot close_med = Median(close, length);
plot low_med = Median(low, length);

and a somewhat interesting lower to go with it:
Code:
declare lower;

input length = 15;

def high_med = Median(high, length);
def close_med = Median(close, length);
def low_med = Median(low, length);

def midline = (high_med + low_med) / 2;
plot moving = close_med - midline;
plot zero = 0;

plot average = inertia(moving, floor(length / 2));
This looks at the position of the close in the channel formed by the high and low median prices. When it is above zero, the median close is closer to the median high. The moving average is the inertia (linear regression fit) over length/2.

guess it pays to read the docs (and re-read them, and perhaps the release notes)
-mashume

JZ4tT1r.png
 
Solution
Replicate this for LOW and CLOSE and adapt those variables accordingly?

Code:
input LengthOfYourChoice;

def hiMedian = median(high,[LengthOfYourChoice]);
AddLabel(yes,"HI Median for "+LengthOfYourChoice+ " Periods is: "+hiMedian,color.yellow);
 

Join useThinkScript to post your question to a community of 21,000+ developers and traders.

Similar threads

Not the exact question you're looking for?

Start a new thread and receive assistance from our community.

87k+ Posts
448 Online
Create Post

Similar threads

Similar threads

The Market Trading Game Changer

Join 2,500+ subscribers inside the useThinkScript VIP Membership Club
  • Exclusive indicators
  • Proven strategies & setups
  • Private Discord community
  • ‘Buy The Dip’ signal alerts
  • Exclusive members-only content
  • Add-ons and resources
  • 1 full year of unlimited support

Frequently Asked Questions

What is useThinkScript?

useThinkScript is the #1 community of stock market investors using indicators and other tools to power their trading strategies. Traders of all skill levels use our forums to learn about scripting and indicators, help each other, and discover new ways to gain an edge in the markets.

How do I get started?

We get it. Our forum can be intimidating, if not overwhelming. With thousands of topics, tens of thousands of posts, our community has created an incredibly deep knowledge base for stock traders. No one can ever exhaust every resource provided on our site.

If you are new, or just looking for guidance, here are some helpful links to get you started.

What are the benefits of VIP Membership?
VIP members get exclusive access to these proven and tested premium indicators: Buy the Dip, Advanced Market Moves 2.0, Take Profit, and Volatility Trading Range. In addition, VIP members get access to over 50 VIP-only custom indicators, add-ons, and strategies, private VIP-only forums, private Discord channel to discuss trades and strategies in real-time, customer support, trade alerts, and much more. Learn all about VIP membership here.
How can I access the premium indicators?
To access the premium indicators, which are plug and play ready, sign up for VIP membership here.
Back
Top