Is there a way to plot percentage of stocks above key thresholds?

PonchoMike

New member
VIP
I know there are indicators such as $SPXA50R that will plot the number of SP500 companies above their 50 SMA. There is also $SPXA100R for the 100 SMA. I came across these indicators totally by accident when reading a post somewhere online. I would like to be able to plot a chart showing the number of SP500 companies with RSI either above 70 or RSI below 30. Is there a way to do this?
 
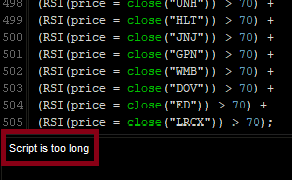
The S&P 500 causes a "Script is too long" error.

The S&P100, NASDAQ100 and DOW seem to work though. I suppose I can do this with any index or ETF component list that isn't too long. I ended up just writing a small program that automatically generates the code from a list of symbols. So if you had anything else in mind just let me know.

ifHehyH.png
 
Could you share how you wrote the thinkscript for the QQQ? What I couldn't figure out was how to convert the quantity of scan results into a number I could plot. I am a hack using thinkscript at best.

It doesn't surprise me that the script is too long. I became a TOS user when the brokerage I was with was acquired by Ameritrade. Back then I was a TC2000 user and created this indicator in Blocks. When plotting a one year chart, it would take ten minutes or more to generate the chart and the application would crash at times.
 
Code:
declare lower;
def x =
(RSI(price = close("AAPL")) > 70) +
(RSI(price = close("MSFT")) > 70) +
(RSI(price = close("AMZN")) > 70) +
(RSI(price = close("AVGO")) > 70) +
(RSI(price = close("NVDA")) > 70) +
(RSI(price = close("META")) > 70) +
(RSI(price = close("TSLA")) > 70) +
(RSI(price = close("GOOGL")) > 70) +
(RSI(price = close("GOOG")) > 70) +
(RSI(price = close("COST")) > 70) +
(RSI(price = close("AMD")) > 70) +
(RSI(price = close("ADBE")) > 70) +
(RSI(price = close("PEP")) > 70) +
(RSI(price = close("NFLX")) > 70) +
(RSI(price = close("CSCO")) > 70) +
(RSI(price = close("INTC")) > 70) +
(RSI(price = close("TMUS")) > 70) +
(RSI(price = close("INTU")) > 70) +
(RSI(price = close("CMCSA")) > 70) +
(RSI(price = close("QCOM")) > 70) +
(RSI(price = close("AMGN")) > 70) +
(RSI(price = close("TXN")) > 70) +
(RSI(price = close("AMAT")) > 70) +
(RSI(price = close("HON")) > 70) +
(RSI(price = close("ISRG")) > 70) +
(RSI(price = close("BKNG")) > 70) +
(RSI(price = close("VRTX")) > 70) +
(RSI(price = close("LRCX")) > 70) +
(RSI(price = close("PANW")) > 70) +
(RSI(price = close("SBUX")) > 70) +
(RSI(price = close("REGN")) > 70) +
(RSI(price = close("MDLZ")) > 70) +
(RSI(price = close("ADI")) > 70) +
(RSI(price = close("GILD")) > 70) +
(RSI(price = close("ADP")) > 70) +
(RSI(price = close("MU")) > 70) +
(RSI(price = close("PDD")) > 70) +
(RSI(price = close("MELI")) > 70) +
(RSI(price = close("KLAC")) > 70) +
(RSI(price = close("SNPS")) > 70) +
(RSI(price = close("CDNS")) > 70) +
(RSI(price = close("PYPL")) > 70) +
(RSI(price = close("MAR")) > 70) +
(RSI(price = close("CSX")) > 70) +
(RSI(price = close("ASML")) > 70) +
(RSI(price = close("CRWD")) > 70) +
(RSI(price = close("ABNB")) > 70) +
(RSI(price = close("CTAS")) > 70) +
(RSI(price = close("MRVL")) > 70) +
(RSI(price = close("WDAY")) > 70) +
(RSI(price = close("ORLY")) > 70) +
(RSI(price = close("ROP")) > 70) +
(RSI(price = close("LULU")) > 70) +
(RSI(price = close("MNST")) > 70) +
(RSI(price = close("NXPI")) > 70) +
(RSI(price = close("CHTR")) > 70) +
(RSI(price = close("ADSK")) > 70) +
(RSI(price = close("PCAR")) > 70) +
(RSI(price = close("MCHP")) > 70) +
(RSI(price = close("FTNT")) > 70) +
(RSI(price = close("DXCM")) > 70) +
(RSI(price = close("CPRT")) > 70) +
(RSI(price = close("ROST")) > 70) +
(RSI(price = close("KHC")) > 70) +
(RSI(price = close("KDP")) > 70) +
(RSI(price = close("PAYX")) > 70) +
(RSI(price = close("IDXX")) > 70) +
(RSI(price = close("ODFL")) > 70) +
(RSI(price = close("AEP")) > 70) +
(RSI(price = close("FAST")) > 70) +
(RSI(price = close("DASH")) > 70) +
(RSI(price = close("DDOG")) > 70) +
(RSI(price = close("AZN")) > 70) +
(RSI(price = close("MRNA")) > 70) +
(RSI(price = close("CTSH")) > 70) +
(RSI(price = close("TEAM")) > 70) +
(RSI(price = close("CEG")) > 70) +
(RSI(price = close("EA")) > 70) +
(RSI(price = close("BIIB")) > 70) +
(RSI(price = close("ZS")) > 70) +
(RSI(price = close("VRSK")) > 70) +
(RSI(price = close("EXC")) > 70) +
(RSI(price = close("CSGP")) > 70) +
(RSI(price = close("GEHC")) > 70) +
(RSI(price = close("GFS")) > 70) +
(RSI(price = close("ON")) > 70) +
(RSI(price = close("XEL")) > 70) +
(RSI(price = close("BKR")) > 70) +
(RSI(price = close("TTD")) > 70) +
(RSI(price = close("CCEP")) > 70) +
(RSI(price = close("CDW")) > 70) +
(RSI(price = close("ANSS")) > 70) +
(RSI(price = close("MDB")) > 70) +
(RSI(price = close("DLTR")) > 70) +
(RSI(price = close("TTWO")) > 70) +
(RSI(price = close("FANG")) > 70) +
(RSI(price = close("SPLK")) > 70) +
(RSI(price = close("WBD")) > 70) +
(RSI(price = close("ILMN")) > 70) +
(RSI(price = close("SIRI")) > 70) +
(RSI(price = close("WBA")) > 70);
plot y = x;
 

Join useThinkScript to post your question to a community of 21,000+ developers and traders.

Similar threads

Not the exact question you're looking for?

Start a new thread and receive assistance from our community.

87k+ Posts
474 Online
Create Post

Similar threads

Similar threads

The Market Trading Game Changer

Join 2,500+ subscribers inside the useThinkScript VIP Membership Club
  • Exclusive indicators
  • Proven strategies & setups
  • Private Discord community
  • ‘Buy The Dip’ signal alerts
  • Exclusive members-only content
  • Add-ons and resources
  • 1 full year of unlimited support

Frequently Asked Questions

What is useThinkScript?

useThinkScript is the #1 community of stock market investors using indicators and other tools to power their trading strategies. Traders of all skill levels use our forums to learn about scripting and indicators, help each other, and discover new ways to gain an edge in the markets.

How do I get started?

We get it. Our forum can be intimidating, if not overwhelming. With thousands of topics, tens of thousands of posts, our community has created an incredibly deep knowledge base for stock traders. No one can ever exhaust every resource provided on our site.

If you are new, or just looking for guidance, here are some helpful links to get you started.

What are the benefits of VIP Membership?
VIP members get exclusive access to these proven and tested premium indicators: Buy the Dip, Advanced Market Moves 2.0, Take Profit, and Volatility Trading Range. In addition, VIP members get access to over 50 VIP-only custom indicators, add-ons, and strategies, private VIP-only forums, private Discord channel to discuss trades and strategies in real-time, customer support, trade alerts, and much more. Learn all about VIP membership here.
How can I access the premium indicators?
To access the premium indicators, which are plug and play ready, sign up for VIP membership here.
Back
Top