
Johnny Cash
Member
Could anyone tell me how to plot the Stochastic Oscillator on multiple timeframes? Both daily and weekly slow stochastic on the same chart.
# Stochastic Full MTF
# blt
# 7.15.2016

# 07.15.2016 blt v0, initial release
# 07.15.2016 blt v1, added on/off input for bubbles

# Here is a Stochastic Full_MTF indicator coded with a similar look
# as the RSI_Laguerre_Time_MTF uses. On the 1min chart image of DAL,
# I have the Stochastic set to a fast seting of 10,3,1, using higher
# agg period of 2min for the Stochastic.
#
# I used TOS Stochastic Full because with it you can do all three
# flavors (full 10,10,3; fast 10,3,1; slow 10,10,1) just changing
# the inputs
#
# This is an enhanced version with inputs to show bubbles or not.
# If you want to see it in expansion to the right, then you need to
# increase your right expansion to approx 35. The bubbles were
# already moveable at the inputs m and z

declare lower;

input usehigheraggperiod = {default "Current", "Higher"};

# Current uses the current chart agg. So if you are on a 1min chart
# the indicator is based on 1min. If you select higher, then whatever
# agg you enter at the input will be what is used for the RSI. So
# if you are on a 1min chart and higher is set to 2min, then a 2min
# RSI and the entries and targets are 2min based.

input agg                = AggregationPeriod.TWO_MIN;
input atrlength          = 14;
input atrfactor          = 3;

# Variables:
def o;
def h;
def l;
def c;
def error = usehigheraggperiod == usehigheraggperiod."Higher" and GetAggregationPeriod() > agg;
switch (usehigheraggperiod) {
case Current:
    o = (open + close[1]) / 2;
    h = Max(high, close[1]);
    l = Min(low, close[1]);
    c = (o + h + l + close) / 4;
case Higher:
    if error {
        o = Double.NaN;
        h = Double.NaN;
        l = Double.NaN;
        c = Double.NaN;
    } else {
        o = (open(period = agg)     + close(period = agg)[1]) / 2;
        h = Max(high(period = agg)  , close(period = agg)[1]);
        l = Min(low(period = agg)   , close(period = agg)[1]);
        c = ((open(period = agg)    + close(period = agg)[1]) / 2
            + Max(high(period = agg), close(period = agg)[1])
            + Min(low(period = agg) , close(period = agg)[1])
            + close(period = agg)) / 4;
    }
}
AddLabel(error, "Chart Aggregation Period is greater than RSI aggregation period. Need to Change input to a higher agg than current chart aggregation or choose 'Current' at input usehigheraggperiod", Color.WHITE);

#TOS StochasticFull
#used TOS StochasticFull because with it you can do all 3 (full 10,10,3; fast 10,3,1; slow 10,10,1) with it by just changing the inputs for kperiod
input over_bought = 80;
input over_sold   = 20;
input KPeriod = 10;
input DPeriod = 10;
input slowing_period = 3;
input averageType = AverageType.SIMPLE;
def priceH = h;
def priceL = l;
def priceC = c;

def lowest_k = Lowest(priceL, KPeriod);
def c1       = priceC - lowest_k;
def c2       = Highest(priceH, KPeriod) - lowest_k;
def FastK    = if c2 != 0
               then c1 / c2 * 100
               else 0;

plot FullK =  if isnan(close) then double.nan else MovingAverage(averageType, FastK, slowing_period);
plot FullD =  if isnan(close) then double.nan else MovingAverage(averageType, FullK, DPeriod);

plot OverBought = if isnan(close) then double.nan else over_bought;
plot OverSold   = if isnan(close) then double.nan else over_sold;

FullK.SetDefaultColor(GetColor(5));
FullD.SetDefaultColor(GetColor(0));
OverBought.SetDefaultColor(GetColor(1));
OverSold.SetDefaultColor(GetColor(1));

def ob = over_bought;
def os = over_sold;
def stou = if FullK crosses above ob or
              FullK crosses above os
           then 1
           else if stou[1] == 1 and !(FullK crosses below ob) and FullK > os
           then 1
           else 0;
FullK.AssignValueColor(if stou
                       then Color.GREEN
                       else Color.RED);
input usealerts = no;
Alert(usealerts and FullK crosses below OverBought, "", Alert.BAR, Sound.Bell);
Alert(usealerts and FullK crosses above OverSold, "", Alert.BAR, Sound.Bell);

AddCloud(if FullK >= OverBought
         then FullK
         else Double.NaN,
         OverBought,
         Color.GREEN, Color.GREEN);
AddCloud(if FullK <= OverSold
         then OverSold
         else Double.NaN,
         FullK,
         Color.RED, Color.RED);

plot mid   = if isnan(close) then double.nan else 50;
plot lineh = if isnan(close) then double.nan else 110;
plot linel = if isnan(close) then double.nan else -10;
lineh.setdefaultColor(color.gray);
linel.setdefaultColor(color.gray);
lineh.hidebubble();
linel.hidebubble();

AddLabel(yes, "STO (" + agg / 60000 + "min): " + Round(FullK, 0),
               if FullK > 0
               then if FullK[1] > FullK
                    then Color.DARK_GREEN
                    else Color.GREEN
               else if FullK[1] < FullK
               then Color.DARK_RED
               else  Color.RED);

def atr    = Average(TrueRange(h, c, l), atrlength);
def entry  = if FullK crosses above OverSold or stou[1] == 0 and FullK crosses above OverBought
             then close
             else if FullK crosses below OverBought or stou[1] and FullK crosses below OverSold
             then close
             else entry[1];
def ebar   = if FullK crosses above OverSold or stou[1] == 0 and FullK crosses above OverBought
             then BarNumber()
             else if FullK crosses below OverBought or stou[1] and FullK crosses below OverSold
             then BarNumber()
             else Double.NaN;
def target = if FullK crosses above OverSold or stou[1] == 0 and FullK crosses above OverBought
             then Round((close + (atrfactor * atr)) / TickSize(), 0) * TickSize()
             else if FullK crosses below OverBought or stou[1] and FullK crosses below OverSold
             then Round((close - (atrfactor * atr)) / TickSize(), 0) * TickSize()
             else target[1];
def u_d    = if FullK crosses above OverSold or stou[1] == 0 and FullK crosses above OverBought
             then 1
             else if FullK crosses below OverBought or stou[1] and FullK crosses below OverSold
             then -1
             else u_d[1];
def goalu  = if u_d > 0  and  high >= target
             then 1
             else if goalu[1] == 1 and u_d > 0
             then 1
             else 0;
def goald  = if u_d < 0 and  low <= target
             then 1
             else if goald[1] == 1 and u_d < 0
             then 1
             else 0;

AddLabel(1,  if error then " "
              else  "T:"+(if u_d > 0 then "Up " else "Dn") + " " + AsText(target) +
                    (if u_d < 0
                     then if  goald == 0
                     then " Need " + AsText(Round((target - close), 2))
                     else " Met "
                     else "") +
                     (if u_d > 0
                      then if goalu == 0
                     then " Need " + AsText(Round((target - close), 2))
                     else " Met "
                     else ""),
              if u_d < 0 and !goald or u_d > 0 and !goalu
              then Color.WHITE
              else Color.GREEN);
input showentrybubble = yes;
input m = 2;
def  m1 = m + 1;
AddChartBubble(showentrybubble and BarNumber() == HighestAll(ebar),
               if FullK crosses above OverSold or stou[1] and FullK crosses below OverSold
               then OverSold
               else OverBought,
               "Entry: " + AsText(Round(entry, 2)),
               if u_d > 0
               then Color.GREEN
               else Color.RED,
               if u_d > 0
               then no
               else yes);
input showtargetbubble = yes;
AddChartBubble(showtargetbubble and IsNaN(close[m]) and !IsNaN(close[m1]),
               if Between(FullK[m1], OverSold, OverBought)
               then FullK[m1]
               else if u_d[m1] > 0
               then 80
               else 20,
               if error[m1]
               then " "
               else "T:"+(if u_d[m1] > 0 then "Up " else "Dn ") + " " + AsText(target[m1]) +
                    (if u_d[m1] < 0 and !goald[m1]
                     then "\nDiff     " + AsText(Round((target[m1] - close[m1]), 2))
                     else if u_d[m1] > 0 and !goalu[m1]
                     then "\nDiff     " + AsText(Round((target[m1] - close[m1]), 2))
                     else " Met "),
              if u_d[m1] < 0 and !goald[m1] or u_d[m1] > 0 and !goalu[m1]
              then Color.WHITE
              else Color.GREEN,
              if Between(FullK[m1], OverSold, OverBought)
              then if u_d[m1] < 0
                   then no
                   else yes
              else if u_d[m1] < 0
              then no
              else yes);
#StochasticFull Bubble
input showstochasticbubble = yes;
input  z = 30;#Hint z: = number of spaces to move the StochasticFull bubbles sideways
def   z1 = z + 1;
AddChartBubble(showstochasticbubble and IsNaN(close[z]) and !IsNaN(close[z1]),
               mid[z1],
               "S",
               if stou[z1]
               then Color.GREEN
else Color.RED);declare lower;
input over_bought = 80;
input over_sold = 20;
input aggregationPeriod = AggregationPeriod.DAY;
input KPeriod = 10;
input DPeriod = 10;
input slowing_period = 3;
plot FullK = Average((close(period = aggregationPeriod) - Lowest(low(period = aggregationperiod), KPeriod)) / (Highest(high(period = aggregationperiod), KPeriod) - Lowest(low(period = aggregationperiod), KPeriod)) * 100, slowing_period);
plot FullD = Average(Average((close(period = aggregationPeriod) - Lowest(low(period = aggregationperiod), KPeriod)) / (Highest(high(period = aggregationperiod), KPeriod) - Lowest(low(period = aggregationperiod), KPeriod)) * 100, slowing_period), DPeriod);
plot OverBought = over_bought;
plot OverSold = over_sold;declare lower;
input over_bought = 80;
input over_sold = 32;
input KPeriod = 10;
input DPeriod = 3;
input aggp = AggregationPeriod.WEEK;
input priceH = high;
input priceL = low;
input priceC = close;
input averageType = AverageType.SIMPLE;
input showBreakoutSignals = {default "No", "On SlowK", "On SlowD", "On SlowK & SlowD"};
def dailywk;
if GetAggregationPeriod() < AggregationPeriod.WEEK {
dailywk = AggregationPeriod.WEEK;
} else {
dailywk = AggregationPeriod.DAY;
}
#def plwk = movingaverage(averagetype.simple,priceL,5);
#def phwk = movingaverage(averagetype.simple,priceH,5) ;
#def pcwk = movingaverage(averagetype.simple,priceC,5) ;
plot SlowK = reference StochasticFull(
over_bought = over_bought,
over_sold = over_sold,
KPeriod = KPeriod,
DPeriod = DPeriod,
priceH = high(period = dailywk),
priceL = low(period = dailywk),
priceC = close(period = dailywk),
slowing_period = 3).FullK
;
plot SlowD = reference StochasticFull(
over_bought = over_bought,
over_sold = over_sold,
KPeriod = KPeriod,
DPeriod = DPeriod,
priceH = high(period = dailywk),
priceL = low(period = dailywk),
priceC = close(period = dailywk),
slowing_period = 3).FullD
;
plot OverBought = over_bought;
plot OverSold = over_sold;
def upK = SlowK crosses above OverSold;
def upD = SlowD crosses above OverSold;
def downK = SlowK crosses below OverBought;
def downD = SlowD crosses below OverBought;
plot UpSignal;
plot DownSignal;
switch (showBreakoutSignals) {
case "No":
UpSignal = Double.NaN;
DownSignal = Double.NaN;
case "On SlowK":
UpSignal = if upK then OverSold else Double.NaN;
DownSignal = if downK then OverBought else Double.NaN;
case "On SlowD":
UpSignal = if upD then OverSold else Double.NaN;
DownSignal = if downD then OverBought else Double.NaN;
case "On SlowK & SlowD":
UpSignal = if upK or upD then OverSold else Double.NaN;
DownSignal = if downK or downD then OverBought else Double.NaN;
}
UpSignal.SetHiding(showBreakoutSignals == showBreakoutSignals."No");
DownSignal.SetHiding(showBreakoutSignals == showBreakoutSignals."No");
SlowK.SetDefaultColor(GetColor(5));
SlowD.SetDefaultColor(GetColor(0));
OverBought.SetDefaultColor(GetColor(1));
OverSold.SetDefaultColor(GetColor(1));
UpSignal.SetDefaultColor(Color.UPTICK);
UpSignal.SetPaintingStrategy(PaintingStrategy.ARROW_UP);
DownSignal.SetDefaultColor(Color.DOWNTICK);
DownSignal.SetPaintingStrategy(PaintingStrategy.ARROW_DOWN);I'm trying to create a weekly stochastic indicator that I can use on my daily chart, but the plot points don't seem to get smoothed like they do on the tradingview version of the indicator. Any thoughts how I could fix that? Here is the code I'm currently using.
ed out?Code:#Example Smooth Plot HigherAgg on LowerAgg #Usethinkscript request AnAirDrop #Sleepyz input show_original_plot = yes; input show_smooth_plot = yes; declare lower; input over_bought = 80; input over_sold = 32; input KPeriod = 10; input DPeriod = 3; input aggp = AggregationPeriod.WEEK; input priceH = high; input priceL = low; input priceC = close; input averageType = AverageType.SIMPLE; input showBreakoutSignals = {default "No", "On SlowK", "On SlowD", "On SlowK & SlowD"}; def dailywk; if GetAggregationPeriod() < AggregationPeriod.WEEK { dailywk = AggregationPeriod.WEEK; } else { dailywk = AggregationPeriod.DAY; } #def plwk = movingaverage(averagetype.simple,priceL,5); #def phwk = movingaverage(averagetype.simple,priceH,5) ; #def pcwk = movingaverage(averagetype.simple,priceC,5) ; plot SlowK = reference StochasticFull( over_bought = over_bought, over_sold = over_sold, KPeriod = KPeriod, DPeriod = DPeriod, priceH = high(period = dailywk), priceL = low(period = dailywk), priceC = close(period = dailywk), slowing_period = 3).FullK ; slowk.sethiding(show_original_plot == no); plot SlowD = reference StochasticFull( over_bought = over_bought, over_sold = over_sold, KPeriod = KPeriod, DPeriod = DPeriod, priceH = high(period = dailywk), priceL = low(period = dailywk), priceC = close(period = dailywk), slowing_period = 3).FullD ; slowd.sethiding(show_original_plot == no); plot OverBought = over_bought; plot OverSold = over_sold; def upK = SlowK crosses above OverSold; def upD = SlowD crosses above OverSold; def downK = SlowK crosses below OverBought; def downD = SlowD crosses below OverBought; plot UpSignal; plot DownSignal; switch (showBreakoutSignals) { case "No": UpSignal = Double.NaN; DownSignal = Double.NaN; case "On SlowK": UpSignal = if upK then OverSold else Double.NaN; DownSignal = if downK then OverBought else Double.NaN; case "On SlowD": UpSignal = if upD then OverSold else Double.NaN; DownSignal = if downD then OverBought else Double.NaN; case "On SlowK & SlowD": UpSignal = if upK or upD then OverSold else Double.NaN; DownSignal = if downK or downD then OverBought else Double.NaN; } UpSignal.SetHiding(showBreakoutSignals == showBreakoutSignals."No"); DownSignal.SetHiding(showBreakoutSignals == showBreakoutSignals."No"); SlowK.SetDefaultColor(GetColor(5)); SlowD.SetDefaultColor(GetColor(0)); OverBought.SetDefaultColor(GetColor(1)); OverSold.SetDefaultColor(GetColor(1)); UpSignal.SetDefaultColor(Color.UPTICK); UpSignal.SetPaintingStrategy(PaintingStrategy.ARROW_UP); DownSignal.SetDefaultColor(Color.DOWNTICK); DownSignal.SetPaintingStrategy(PaintingStrategy.ARROW_DOWN); #Smoothed Plots def minutes = aggp/60000; def bar = BarNumber(); def x = if bar == 1 or bar[1] % ((Ceil(minutes) ) / (GetAggregationPeriod() / 60000)) == 0 then slowk else x[1]; def xx = (if x!=x[1] then xx[1] + 1 else xx[1]); def xxx = if xx!= xx[1] then x else Double.NaN; plot xsmooth =if !show_smooth_plot then double.nan else if isnan(close[-1]) then slowk else xxx; xsmooth.EnableApproximation(); def x1 = if bar == 1 or bar[1] % ((Ceil(minutes) ) / (GetAggregationPeriod() / 60000)) == 0 then slowd else x1[1]; def xx1 = (if x1!=x1[1] then xx1[1] + 1 else xx[1]); def xxx1 = if xx1!= xx1[1] then x1 else Double.NaN; plot x1smooth = if !show_smooth_plot then double.nan else if isnan(close[-1]) then slowd else xxx1; x1smooth.EnableApproximation(); Any thoughts how I can get those plots smooth
#Example Smooth Plot HigherAgg on LowerAgg
#Usethinkscript request AnAirDrop
#Sleepyz

input show_original_plot = yes;
input show_smooth_plot   = yes;

declare lower;

input over_bought = 80;
input over_sold = 32;
input KPeriod = 10;
input DPeriod = 3;
input aggp = AggregationPeriod.WEEK;
input priceH = high;
input priceL = low;
input priceC = close;
input averageType = AverageType.SIMPLE;
input showBreakoutSignals = {default "No", "On SlowK", "On SlowD", "On SlowK & SlowD"};

def dailywk;
if GetAggregationPeriod() < AggregationPeriod.WEEK {
    dailywk = AggregationPeriod.WEEK;
} else {
    dailywk = AggregationPeriod.DAY;
}


#def plwk = movingaverage(averagetype.simple,priceL,5);
#def phwk = movingaverage(averagetype.simple,priceH,5) ;
#def pcwk = movingaverage(averagetype.simple,priceC,5) ;

plot SlowK = reference StochasticFull(
    over_bought = over_bought,
    over_sold = over_sold,
    KPeriod = KPeriod,
    DPeriod = DPeriod,
    priceH = high(period = dailywk),
    priceL = low(period = dailywk),
    priceC = close(period = dailywk),
    slowing_period = 3).FullK
;
slowk.sethiding(show_original_plot == no);

plot SlowD = reference StochasticFull(
    over_bought = over_bought,
    over_sold = over_sold,
    KPeriod = KPeriod,
    DPeriod = DPeriod,
    priceH = high(period = dailywk),
    priceL = low(period = dailywk),
    priceC = close(period = dailywk),
    slowing_period = 3).FullD
;
slowd.sethiding(show_original_plot == no);


plot OverBought = over_bought;
plot OverSold = over_sold;

def upK = SlowK crosses above OverSold;
def upD = SlowD crosses above OverSold;
def downK = SlowK crosses below OverBought;
def downD = SlowD crosses below OverBought;

plot UpSignal;
plot DownSignal;
switch (showBreakoutSignals) {
case "No":
    UpSignal = Double.NaN;
    DownSignal = Double.NaN;
case "On SlowK":
    UpSignal = if upK then OverSold else Double.NaN;
    DownSignal = if downK then OverBought else Double.NaN;
case "On SlowD":
    UpSignal = if upD then OverSold else Double.NaN;
    DownSignal = if downD then OverBought else Double.NaN;
case "On SlowK & SlowD":
    UpSignal = if upK or upD then OverSold else Double.NaN;
    DownSignal = if downK or downD then OverBought else Double.NaN;
}

UpSignal.SetHiding(showBreakoutSignals == showBreakoutSignals."No");
DownSignal.SetHiding(showBreakoutSignals == showBreakoutSignals."No");

SlowK.SetDefaultColor(GetColor(5));
SlowD.SetDefaultColor(GetColor(0));
OverBought.SetDefaultColor(GetColor(1));
OverSold.SetDefaultColor(GetColor(1));
UpSignal.SetDefaultColor(Color.UPTICK);
UpSignal.SetPaintingStrategy(PaintingStrategy.ARROW_UP);
DownSignal.SetDefaultColor(Color.DOWNTICK);
DownSignal.SetPaintingStrategy(PaintingStrategy.ARROW_DOWN);


#Smoothed Plots
def minutes = aggp/60000;
def bar = BarNumber();
def x = if bar == 1 or bar[1] % ((Ceil(minutes) ) / (GetAggregationPeriod() / 60000)) == 0
        then slowk
        else x[1];

def xx = (if x!=x[1] then xx[1] + 1 else xx[1]);
def xxx = if  xx!= xx[1] then x else Double.NaN;
plot xsmooth =if !show_smooth_plot then double.nan else  if isnan(close[-1]) then slowk else xxx;
xsmooth.EnableApproximation();

def x1 = if bar == 1 or bar[1] % ((Ceil(minutes) ) / (GetAggregationPeriod() / 60000)) == 0
        then slowd
        else x1[1];

def xx1 = (if x1!=x1[1] then xx1[1] + 1 else xx[1]);
def xxx1 = if  xx1!= xx1[1] then x1 else Double.NaN;
plot x1smooth = if !show_smooth_plot then double.nan else if isnan(close[-1]) then slowd else xxx1;
x1smooth.EnableApproximation();Wow, that is awesome work, been looking for that for a long time.
Question: is it possible to get rid of the zig zag line( the original plot) when i set to "no" the all thing disappears.
Oops. thank you for the heads up. I fixed the code above in #13. I forgot that I needed those plot statements. Following is the corrected code:
Code:#Example Smooth Plot HigherAgg on LowerAgg #Usethinkscript request AnAirDrop #Sleepyz input show_original_plot = yes; input show_smooth_plot = yes; declare lower; input over_bought = 80; input over_sold = 32; input KPeriod = 10; input DPeriod = 3; input aggp = AggregationPeriod.WEEK; input priceH = high; input priceL = low; input priceC = close; input averageType = AverageType.SIMPLE; input showBreakoutSignals = {default "No", "On SlowK", "On SlowD", "On SlowK & SlowD"}; def dailywk; if GetAggregationPeriod() < AggregationPeriod.WEEK { dailywk = AggregationPeriod.WEEK; } else { dailywk = AggregationPeriod.DAY; } #def plwk = movingaverage(averagetype.simple,priceL,5); #def phwk = movingaverage(averagetype.simple,priceH,5) ; #def pcwk = movingaverage(averagetype.simple,priceC,5) ; plot SlowK = reference StochasticFull( over_bought = over_bought, over_sold = over_sold, KPeriod = KPeriod, DPeriod = DPeriod, priceH = high(period = dailywk), priceL = low(period = dailywk), priceC = close(period = dailywk), slowing_period = 3).FullK ; slowk.sethiding(show_original_plot == no); plot SlowD = reference StochasticFull( over_bought = over_bought, over_sold = over_sold, KPeriod = KPeriod, DPeriod = DPeriod, priceH = high(period = dailywk), priceL = low(period = dailywk), priceC = close(period = dailywk), slowing_period = 3).FullD ; slowd.sethiding(show_original_plot == no); plot OverBought = over_bought; plot OverSold = over_sold; def upK = SlowK crosses above OverSold; def upD = SlowD crosses above OverSold; def downK = SlowK crosses below OverBought; def downD = SlowD crosses below OverBought; plot UpSignal; plot DownSignal; switch (showBreakoutSignals) { case "No": UpSignal = Double.NaN; DownSignal = Double.NaN; case "On SlowK": UpSignal = if upK then OverSold else Double.NaN; DownSignal = if downK then OverBought else Double.NaN; case "On SlowD": UpSignal = if upD then OverSold else Double.NaN; DownSignal = if downD then OverBought else Double.NaN; case "On SlowK & SlowD": UpSignal = if upK or upD then OverSold else Double.NaN; DownSignal = if downK or downD then OverBought else Double.NaN; } UpSignal.SetHiding(showBreakoutSignals == showBreakoutSignals."No"); DownSignal.SetHiding(showBreakoutSignals == showBreakoutSignals."No"); SlowK.SetDefaultColor(GetColor(5)); SlowD.SetDefaultColor(GetColor(0)); OverBought.SetDefaultColor(GetColor(1)); OverSold.SetDefaultColor(GetColor(1)); UpSignal.SetDefaultColor(Color.UPTICK); UpSignal.SetPaintingStrategy(PaintingStrategy.ARROW_UP); DownSignal.SetDefaultColor(Color.DOWNTICK); DownSignal.SetPaintingStrategy(PaintingStrategy.ARROW_DOWN); #Smoothed Plots def minutes = aggp/60000; def bar = BarNumber(); def x = if bar == 1 or bar[1] % ((Ceil(minutes) ) / (GetAggregationPeriod() / 60000)) == 0 then slowk else x[1]; def xx = (if x!=x[1] then xx[1] + 1 else xx[1]); def xxx = if xx!= xx[1] then x else Double.NaN; plot xsmooth =if !show_smooth_plot then double.nan else if isnan(close[-1]) then slowk else xxx; xsmooth.EnableApproximation(); def x1 = if bar == 1 or bar[1] % ((Ceil(minutes) ) / (GetAggregationPeriod() / 60000)) == 0 then slowd else x1[1]; def xx1 = (if x1!=x1[1] then xx1[1] + 1 else xx[1]); def xxx1 = if xx1!= xx1[1] then x1 else Double.NaN; plot x1smooth = if !show_smooth_plot then double.nan else if isnan(close[-1]) then slowd else xxx1; x1smooth.EnableApproximation();
Thank you for the kind remark.
I am looking for help to create a label that pulls data from a higher aggregation period. For example, I want to look at the daily chart and have a label that tells me if the StochasticSlow, SlowK is greater than the StochasticSlow, SlowK from the candle before on the weekly chart. I wrote the following code below but it only tells me the information from the current aggregation period that I am looking at and not the weekly. Any help would be greatly appreciated.
input firstAggregation = AggregationPeriod.WEEK;
def StochasticSlowUp;
if GetAggregationPeriod() <= firstAggregation
{
StochasticSlowUp = StochasticSlow("average type" = "EXPONENTIAL")."SlowK" is greater than StochasticSlow("average type" = "EXPONENTIAL")."SlowK" from 1 bars ago;
}
else {
StochasticSlowUp = 0;
}
addlabel(yes, StochasticSlowUp);
 Ruby:
Ruby:input firstAggregation = AggregationPeriod.WEEK; Script stochslow { input agg = aggregationPeriod.WEEK; input over_bought = 80; input over_sold = 20; input KPeriod = 10; input DPeriod = 10; def priceH = high(period=agg); def priceL = low(period=agg); def priceC = close(period=agg); input averageType = AverageType.SIMPLE; input showBreakoutSignals = {default "No", "On SlowK", "On SlowD", "On SlowK & SlowD"}; plot SlowK = reference StochasticFull(over_bought,over_sold,KPeriod,DPeriod,priceH,priceL,priceC,3,averageType).FullK; plot SlowD = reference StochasticFull(over_bought,over_sold,KPeriod,DPeriod,priceH,priceL,priceC,3,averageType).FullD; plot OverBought = over_bought; plot OverSold = over_sold; } def StochasticSlowUp; if GetAggregationPeriod() <= firstAggregation { StochasticSlowUp = stochslow().SlowK from 1 bars ago; } else { StochasticSlowUp = 0; } addlabel(yes, StochasticSlowUp);
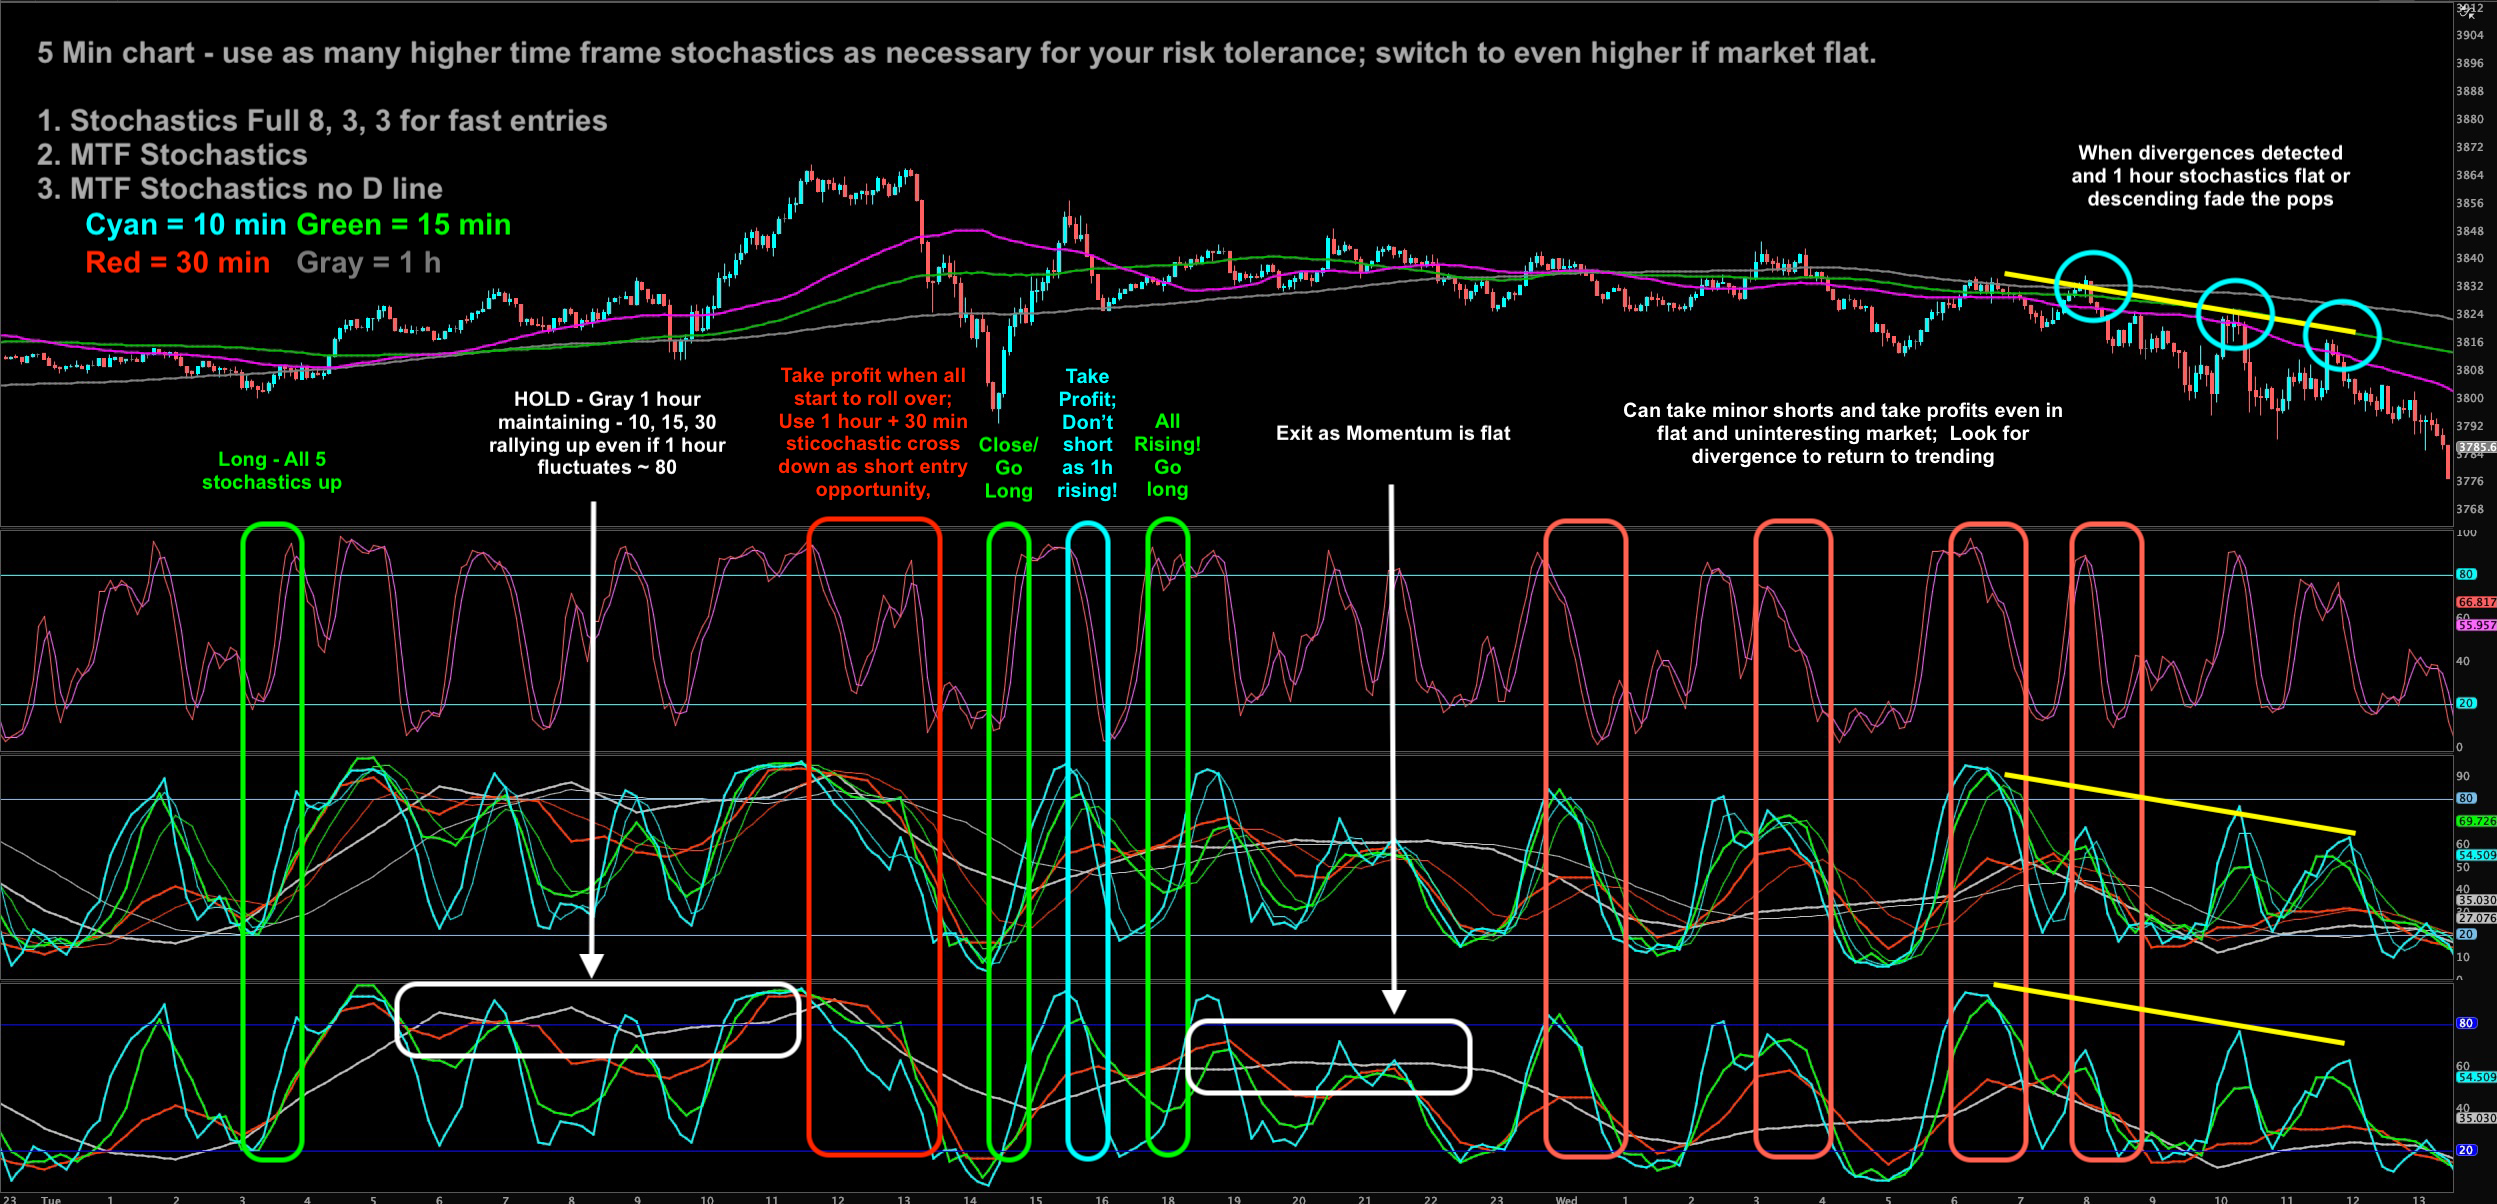
## Multi Time Frame Stochastics Smoothed - 4 Stochastics - v1.0
## ------------------------------------------------------------
##
## 1. Plots multiple higher time frame stochastic oscillators in single subgraph
## 2. Uses approximation smoothing for MTF rendering
## 3. Self-adjusts based on current time frame and higher aggregation inputs
## 4. Assumes extended hours are on when using Daily or Weekly aggregations (Futures trading)
##    - If you are not using Daily or Weekly aggregations, you can use this with
##      any time setting on any instrument
##    - If you are trading a product that does not use extended hours, please adjust
##      number of seconds in Day and Week definitions inside GetTFMin()
## 5. Recommended for 1m, 3m, or 5m charts along with one additional regular Stochastic Full
##    study set at 8, 3, 3 for fast entry while watching this indicator for confirmation
## 6. Chart setup would include:
##    - Your favorite SMA/EMA - (10, 30, 50, 100, 200)
##    - Good working knowledge of basic price action to see what would normally make sense
##    - Stochastic Full 8, 3, 3 for fast entry warning
##    - This indicator for confirmation filtering from fast Stochastic
## 7. Recommend to start on 5 min chart
##
## Author: W3bMastah
##
## Inspired by post "MTF Stochastic Oscillator for ThinkorSwim"
## https://usethinkscript.com/threads/mtf-stochastic-oscillator-for-thinkorswim.899/
##
## Original request AnAirDrop original smoothing function by Sleepyz
## Modified to accommodate up to 4 higher time frames.

declare lower;

input over_bought = 80;
input over_sold = 20;
input KPeriod = 8;
input DPeriod = 3;
input slowing_period = 3;

input aggregationPeriod1 = AggregationPeriod.TEN_MIN;
input aggregationPeriod2 = AggregationPeriod.FIFTEEN_MIN;
input aggregationPeriod3 = AggregationPeriod.THIRTY_MIN;
input aggregationPeriod4 = AggregationPeriod.HOUR;

Assert(aggregationPeriod1 > GetAggregationPeriod() and aggregationPeriod2 > GetAggregationPeriod() and aggregationPeriod3 > GetAggregationPeriod(), "Must use higher time frames for aggregation period");

def dFullK1 = Average((close(period = aggregationPeriod1) - Lowest(low(period = aggregationperiod1), KPeriod)) / (Highest(high(period = aggregationperiod1), KPeriod) - Lowest(low(period = aggregationperiod1), KPeriod)) * 100, slowing_period);
def dFullD1 = Average(Average((close(period = aggregationPeriod1) - Lowest(low(period = aggregationperiod1), KPeriod)) / (Highest(high(period = aggregationperiod1), KPeriod) - Lowest(low(period = aggregationperiod1), KPeriod)) * 100, slowing_period), DPeriod);

def dFullK2 = Average((close(period = aggregationPeriod2) - Lowest(low(period = aggregationperiod2), KPeriod)) / (Highest(high(period = aggregationperiod2), KPeriod) - Lowest(low(period = aggregationperiod2), KPeriod)) * 100, slowing_period);
def dFullD2 = Average(Average((close(period = aggregationPeriod2) - Lowest(low(period = aggregationperiod2), KPeriod)) / (Highest(high(period = aggregationperiod2), KPeriod) - Lowest(low(period = aggregationperiod2), KPeriod)) * 100, slowing_period), DPeriod);

def dFullK3 = Average((close(period = aggregationPeriod3) - Lowest(low(period = aggregationperiod3), KPeriod)) / (Highest(high(period = aggregationperiod3), KPeriod) - Lowest(low(period = aggregationperiod3), KPeriod)) * 100, slowing_period);
def dFullD3 = Average(Average((close(period = aggregationPeriod3) - Lowest(low(period = aggregationperiod3), KPeriod)) / (Highest(high(period = aggregationperiod3), KPeriod) - Lowest(low(period = aggregationperiod3), KPeriod)) * 100, slowing_period), DPeriod);

def dFullK4 = Average((close(period = aggregationPeriod4) - Lowest(low(period = aggregationperiod4), KPeriod)) / (Highest(high(period = aggregationperiod4), KPeriod) - Lowest(low(period = aggregationperiod4), KPeriod)) * 100, slowing_period);
def dFullD4 = Average(Average((close(period = aggregationPeriod4) - Lowest(low(period = aggregationperiod4), KPeriod)) / (Highest(high(period = aggregationperiod4), KPeriod) - Lowest(low(period = aggregationperiod4), KPeriod)) * 100, slowing_period), DPeriod);

plot OverBought = over_bought;
plot OverSold = over_sold;

OverBought.SetDefaultColor(Color.BLUE);
OverSold.SetDefaultColor(Color.BLUE);

## Declare function to get time in minutes from given time

script GetTFMin {
    input higherPeriod = AggregationPeriod.FIFTEEN_MIN;
    plot higherPeriodMin =
         if higherPeriod <= AggregationPeriod.MIN then 1
    else if higherPeriod <= AggregationPeriod.TWO_MIN then 2
    else if higherPeriod <= AggregationPeriod.THREE_MIN then 3
    else if higherPeriod <= AggregationPeriod.FIVE_MIN then 5
    else if higherPeriod <= AggregationPeriod.TEN_MIN then 10
    else if higherPeriod <= AggregationPeriod.FIFTEEN_MIN then 15
    else if higherPeriod <= AggregationPeriod.THIRTY_MIN then 30
    else if higherPeriod <= AggregationPeriod.HOUR then 60
    else if higherPeriod <= AggregationPeriod.TWO_HOURS then 120
    else if higherPeriod <= AggregationPeriod.FOUR_HOURS then 240
    else if higherPeriod <= AggregationPeriod.DAY then 1440 ## Assumes extended hour days
    else if higherPeriod <= AggregationPeriod.WEEK then 10080 ## Assumes extended hour days
    else 1;
};

## Get smoothing time divisor and smooth bars for FullK and FullD

def currentPeriodInMin = GetTFMin(GetAggregationPeriod());

def divisor1 = currentPeriodInMin / GetTFMin(aggregationPeriod1);
def divisor2 = currentPeriodInMin / GetTFMin(aggregationPeriod2);
def divisor3 = currentPeriodInMin / GetTFMin(aggregationPeriod3);
def divisor4 = currentPeriodInMin / GetTFMin(aggregationPeriod4);

## Get current bar number for smoothing lookback

def bar = BarNumber();

## Smoothed Plots 1

def x1K = if bar == 1 or bar[1] % ((Ceil(divisor1) ) / divisor1) == 0 then dFullK1 else x1K[1];
def xx1K = (if x1K!=x1K[1] then xx1K[1] + 1 else xx1K[1]);
def xxx1K = if  xx1K!= xx1K[1] then x1K else Double.NaN;
plot FullK1 = if isnan(close[-1]) then dFullK1 else xxx1K;
FullK1.EnableApproximation();
FullK1.SetLineWeight(2);
FullK1.SetPaintingStrategy(PaintingStrategy.LINE);
FullK1.SetDefaultColor(Color.CYAN);

def x1D = if bar == 1 or bar[1] % ((Ceil(divisor1) ) / divisor1) == 0 then dFullD1 else x1D[1];
def xx1D = (if x1D!=x1D[1] then xx1D[1] + 1 else xx1D[1]);
def xxx1D = if  xx1D!= xx1D[1] then x1D else Double.NaN;
plot FullD1 = if isnan(close[-1]) then dFullD1 else xxx1D;
FullD1.EnableApproximation();
FullD1.SetPaintingStrategy(PaintingStrategy.LINE);
FullD1.SetDefaultColor(Color.CYAN);

## Smoothed Plots 2

def x2K = if bar == 1 or bar[1] % ((Ceil(divisor2) ) / divisor2) == 0 then dFullK2 else x2K[1];
def xx2K = (if x2K!=x2K[1] then xx2K[1] + 1 else xx2K[1]);
def xxx2K = if  xx2K!= xx2K[1] then x2K else Double.NaN;
plot FullK2 = if isnan(close[-1]) then dFullK2 else xxx2K;
FullK2.EnableApproximation();
FullK2.SetLineWeight(2);
FullK2.SetPaintingStrategy(PaintingStrategy.LINE);
FullK2.SetDefaultColor(Color.GREEN);

def x2D = if bar == 1 or bar[1] % ((Ceil(divisor2) ) / divisor2) == 0 then dFullD2 else x2D[1];
def xx2D = (if x2D!=x2D[1] then xx2D[1] + 1 else xx2D[1]);
def xxx2D = if  xx2D!= xx2D[1] then x2D else Double.NaN;
plot FullD2 = if isnan(close[-1]) then dFullD2 else xxx2D;
FullD2.EnableApproximation();
FullD2.SetPaintingStrategy(PaintingStrategy.LINE);
FullD2.SetDefaultColor(Color.GREEN);

## Smoothed Plots 3

def x3K = if bar == 1 or bar[1] % ((Ceil(divisor3) ) / divisor3) == 0 then dFullK3 else x3K[1];
def xx3K = (if x3K!=x3K[1] then xx3K[1] + 1 else xx3K[1]);
def xxx3K = if  xx3K!= xx3K[1] then x3K else Double.NaN;
plot FullK3 = if isnan(close[-1]) then dFullK3 else xxx3K;
FullK3.EnableApproximation();
FullK3.SetLineWeight(2);
FullK3.SetPaintingStrategy(PaintingStrategy.LINE);
FullK3.SetDefaultColor(Color.LIGHT_RED);

def x3D = if bar == 1 or bar[1] % ((Ceil(divisor3) ) / divisor3) == 0 then dFullD3 else x3D[1];
def xx3D = (if x3D!=x3D[1] then xx3D[1] + 1 else xx3D[1]);
def xxx3D = if  xx3D!= xx3D[1] then x3D else Double.NaN;
plot FullD3 = if isnan(close[-1]) then dFullD3 else xxx3D;
FullD3.EnableApproximation();
FullD3.SetPaintingStrategy(PaintingStrategy.LINE);
FullD3.SetDefaultColor(Color.LIGHT_RED);

## Smoothed Plots 4

def x4K = if bar == 1 or bar[1] % ((Ceil(divisor3) ) / divisor3) == 0 then dFullK4 else x4K[1];
def xx4K = (if x4K!=x4K[1] then xx4K[1] + 1 else xx4K[1]);
def xxx4K = if  xx4K!= xx4K[1] then x4K else Double.NaN;
plot FullK4 = if isnan(close[-1]) then dFullK4 else xxx4K;
FullK4.EnableApproximation();
FullK4.SetLineWeight(2);
FullK4.SetPaintingStrategy(PaintingStrategy.LINE);
FullK4.SetDefaultColor(Color.LIGHT_GRAY);

def x4D = if bar == 1 or bar[1] % ((Ceil(divisor3) ) / divisor3) == 0 then dFullD4 else x4D[1];
def xx4D = (if x4D!=x4D[1] then xx4D[1] + 1 else xx4D[1]);
def xxx4D = if  xx4D!= xx4D[1] then x4D else Double.NaN;
plot FullD4 = if isnan(close[-1]) then dFullD4 else xxx4D;
FullD4.EnableApproximation();
FullD4.SetPaintingStrategy(PaintingStrategy.LINE);
FullD4.SetDefaultColor(Color.LIGHT_GRAY);

###############
## End Script #
###############Join useThinkScript to post your question to a community of 21,000+ developers and traders.
| Thread starter | Similar threads | Forum | Replies | Date |
|---|---|---|---|---|
| B | MTF Stochastic | Questions | 1 | |
| N | Wanting MTF Stochastic Momentum Index Labels | Questions | 1 | |
|
|
MTF Stochastic Full Cross? | Questions | 3 | |
| D | MTF Stochastic "Stoplight" Upper Study | Questions | 6 | |
|
|
MTF evaluation of Strategy | Questions | 3 |
Start a new thread and receive assistance from our community.
useThinkScript is the #1 community of stock market investors using indicators and other tools to power their trading strategies. Traders of all skill levels use our forums to learn about scripting and indicators, help each other, and discover new ways to gain an edge in the markets.
We get it. Our forum can be intimidating, if not overwhelming. With thousands of topics, tens of thousands of posts, our community has created an incredibly deep knowledge base for stock traders. No one can ever exhaust every resource provided on our site.
If you are new, or just looking for guidance, here are some helpful links to get you started.