You should upgrade or use an alternative browser.
Impulse MACD [LazyBear] For ThinkOrSwim
- Thread starter kelvin
- Start date
Join useThinkScript to post your question to a community of 21,000+ developers and traders.
How can I convert this into a scan?
plot scan =  mdc==2 and mdc[1] !=2 ;
scan.hide();In the Scan Hacker, SELECT the name of the script that you saved and build your filter in the condition wizard.
scan is true
read more:
https://usethinkscript.com/threads/how-to-use-thinkorswim-stock-hacker-scans.284/
@BenTen
Can you help me?
I like to use "Impulse MACD".
https://usethinkscript.com/threads/impulse-macd-lazybear-for-thinkorswim.13333/page-2
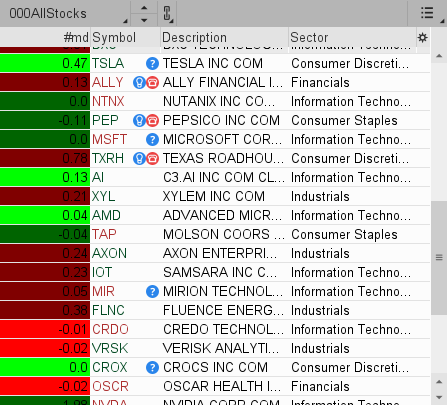
I need code for the watchlist to show the value of the Impulse MACD itself and highlight the cell with the color of the Impulse MACD line (I converted the md value from the histogram to a line on the chart).
Thank you very much for your help!
shared watchlist script link: http://tos.mx/x3CkPc8 Click here for --> Easiest way to load shared links

#study("Impulse MACD [LazyBear]", shorttitle="IMACD_LB", overlay=false)
# Converted by Sam4Cok@Samer800 - 11/2022

input lengthMA = 34;
input lengthSignal = 9;
input src = hlc3;

def na = Double.NaN;
#calc_smma(src, len) =>
script calc_smma {
input src = close;
input len = 34;
    def smma = if isNaN(smma[1]) then SimpleMovingAvg(src, len) else (smma[1] * (len - 1) + src) / len;
    plot return = smma;
}
#calc_zlema(src, length) =>
script calc_zlema {
input src = close;
input length = 34;
    def ema1 = ExpAverage(src, length);
    def ema2 = ExpAverage(ema1, length);
    def d    = ema1-ema2;
    def zelma = ema1+d;
 plot return = zelma;
}

def hi=calc_smma(high, lengthMA);
def lo=calc_smma(low, lengthMA);
def mi=calc_zlema(src, lengthMA);

def md = if (mi>hi)then (mi-hi) else if (mi<lo) then (mi - lo) else 0;
def sb = SimpleMovingAvg(md, lengthSignal);
def sh=md-sb;
def mdc = if src>mi then if src>hi then 2 else 1 else if src<lo then -2 else -1;

plot ImpulseMACD = md;

AssignBackgroundColor(if mdc==2 then Color.GREEN else
                             if mdc==1 then Color.DARK_GREEN else
                             if mdc==-2 then Color.RED else Color.DARK_RED);
@BIG
Many thanks for the help! Understood, everything works!Impulse MACD Watchlist
shared watchlist script link: http://tos.mx/x3CkPc8 Click here for --> Easiest way to load shared links

Ruby:#study("Impulse MACD [LazyBear]", shorttitle="IMACD_LB", overlay=false) # Converted by Sam4Cok@Samer800 - 11/2022 input lengthMA = 34; input lengthSignal = 9; input src = hlc3; def na = Double.NaN; #calc_smma(src, len) => script calc_smma { input src = close; input len = 34; def smma = if isNaN(smma[1]) then SimpleMovingAvg(src, len) else (smma[1] * (len - 1) + src) / len; plot return = smma; } #calc_zlema(src, length) => script calc_zlema { input src = close; input length = 34; def ema1 = ExpAverage(src, length); def ema2 = ExpAverage(ema1, length); def d = ema1-ema2; def zelma = ema1+d; plot return = zelma; } def hi=calc_smma(high, lengthMA); def lo=calc_smma(low, lengthMA); def mi=calc_zlema(src, lengthMA); def md = if (mi>hi)then (mi-hi) else if (mi<lo) then (mi - lo) else 0; def sb = SimpleMovingAvg(md, lengthSignal); def sh=md-sb; def mdc = if src>mi then if src>hi then 2 else 1 else if src<lo then -2 else -1; plot ImpulseMACD = md; AssignBackgroundColor(if mdc==2 then Color.GREEN else if mdc==1 then Color.DARK_GREEN else if mdc==-2 then Color.RED else Color.DARK_RED);
@BIG
JP782
Active member
I tried replacing 3 sections with this:
input agg = AggregationPeriod.TWO_MIN;
def src = close(period = agg);
but on the third section for calc_zlema it hit me with bunch of errors I dont know how to fix?:
'high' can not be used here because of CL predefined const declaration: _inline_referenced_param_bSRP_17239_agg at 37:18
'low' can not be used here because of CL predefined const declaration: _inline_referenced_param_bSRP_17261_agg at 38:18
To create a MTF script, all parts of the candle must be coded to the higher timeframe:
read more: https://usethinkscript.com/threads/converting-indicator-to-multi-timeframe-mtf-in-thinkorswim.8050/input agg = AggregationPeriod.TWO_HOURS;
def cclose = close(period = agg);
def hhigh = high(period = agg) ;
def llow = low(period = agg) ;
def ssrc = hlc3(period = agg);
Find the complete code below.

# MTF Multi-Timeframe repainting
#study("Impulse MACD [LazyBear]", shorttitle="IMACD_LB", overlay=false)
# Converted by Sam4Cok@Samer800 - 11/2022

declare lower;
input BarColor = no;#input(false, title="Enable bar colors")
input lengthMA = 34;
input lengthSignal = 9;

input agg = AggregationPeriod.TWO_HOURS;
def cclose = close(period = agg);
def hhigh = high(period = agg) ;
def llow = low(period = agg) ;
def ssrc = hlc3(period = agg);

def na = Double.NaN;
#calc_smma(src, len) =>
script calc_smma {
input src = close;
input len = 34;
    def smma = if isNaN(smma[1]) then SimpleMovingAvg(src, len) else (smma[1] * (len - 1) + src) / len;
    plot return = smma;
}
#calc_zlema(src, length) =>
script calc_zlema {
input src = close;
input length = 34;
    def ema1 = ExpAverage(src, length);
    def ema2 = ExpAverage(ema1, length);
    def d    = ema1-ema2;
    def zelma = ema1+d;
 plot return = zelma;
}

def hi=calc_smma(hhigh, lengthMA);
def lo=calc_smma(llow, lengthMA);
def mi=calc_zlema(ssrc, lengthMA);

def md = if (mi>hi)then (mi-hi) else if (mi<lo) then (mi - lo) else 0;
def sb = SimpleMovingAvg(md, lengthSignal);
def sh=md-sb;
def mdc = if ssrc>mi then if ssrc>hi then 2 else 1 else if ssrc<lo then -2 else -1;

#--- PLots
plot ImpulseSignal = sb;
ImpulseSignal.SetDefaultColor(Color.WHITE);
ImpulseSignal.SetLineWeight(2);

plot ImpulseHisto = sh;
ImpulseHisto.SetPaintingStrategy(PaintingStrategy.SQUARED_HISTOGRAM);
ImpulseHisto.SetDefaultColor(Color.blue);

plot ImpulseMACD = md;
ImpulseMACD.SetPaintingStrategy(PaintingStrategy.HISTOGRAM);
ImpulseMACD.AssignValueColor(if mdc==2 then Color.GREEN else
                             if mdc==1 then Color.DARK_GREEN else
                             if mdc==-2 then Color.RED else Color.DARK_RED);

plot "0" = if isNaN(close) then na else 0;
"0".SetDefaultColor(Color.DARK_GRAY);

#--- Bar Color
AssignPriceColor(if !BarColor then Color.CURRENT else
                 if mdc==2 then Color.GREEN else
                 if mdc==1 then Color.DARK_GREEN else
                 if mdc==-2 then Color.RED else Color.DARK_RED);


#--- END Code
@JP782
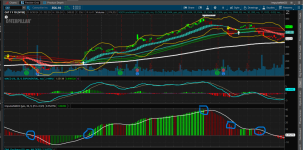
I would like to scan for bright red and bright green histograms as well as darker red and darker greens as shown by the circles in the pic. Is there a way to scan for these? Thanks in advance.
Add the following code snippet to the bottom of your study.
plot scan1 =  mdc==2 and mdc[1] !=2 ;  #scan for 1st Color.GREEN
plot scan2 =  mdc==1 and mdc[1] !=1 ;   #scan for 1st  Color.DARK_GREEN
plot scan3 =  mdc==-2 and mdc[1] !=-2 ; #scan for 1st Color.RED
plot scan4 =  mdc==-1 and mdc[1] !=-1 ;  #scan for 1st Color.DARK_RED
scan1.hide();  scan2.hide();  scan3.hide();  scan4.hide();
To set up scanner, follow the steps in this tutorial:
https://usethinkscript.com/threads/how-to-use-thinkorswim-stock-hacker-scans.284/
wow...thank you very much for your fast coding !! Amazing work!Add the following code snippet to the bottom of your study.
Ruby:plot scan1 = mdc==2 and mdc[1] !=2 ; #scan for 1st Color.GREEN plot scan2 = mdc==1 and mdc[1] !=1 ; #scan for 1st Color.DARK_GREEN plot scan3 = mdc==-2 and mdc[1] !=-2 ; #scan for 1st Color.RED plot scan4 = mdc==-1 and mdc[1] !=-1 ; #scan for 1st Color.DARK_RED scan1.hide(); scan2.hide(); scan3.hide(); scan4.hide();
To set up scanner, follow the steps in this tutorial:
https://usethinkscript.com/threads/how-to-use-thinkorswim-stock-hacker-scans.284/
Could someone help me on how to create an alert study for the Impulse MACD to alert me when the histogram goes from green to red and from red to green. Basically when the momentum shifts.
Alerts For Changes In Momentum
add the following snippet to the bottom of your study:
plot scan1 =  mdc==2 and mdc[1] !=2 ;  #scan for 1st Color.GREEN
plot scan2 =  mdc==1 and mdc[1] !=1 ;   #scan for 1st  Color.DARK_GREEN
plot scan3 =  mdc==-2 and mdc[1] !=-2 ; #scan for 1st Color.RED
plot scan4 =  mdc==-1 and mdc[1] !=-1 ;  #scan for 1st Color.DARK_RED
scan1.hide();  scan2.hide();  scan3.hide();  scan4.hide();
Alert(scan1, "color.green", Alert.Bar, Sound.ding);
Alert(scan2, "color.dark_green", Alert.Bar, Sound.ding);
Alert(scan3, "color.red", Alert.Bar, Sound.Bell);
Alert(scan4, "color.dark_red", Alert.Bar, Sound.Bell);| Thread starter | Similar threads | Forum | Replies | Date |
|---|---|---|---|---|
|
|
Elder Impulse Indicator for ThinkorSwim | Indicators | 7 | |
| D | MACD-V For ThinkOrSwim | Indicators | 12 | |
| P | Ultimate MACD For ThinkOrSwim | Indicators | 16 | |
|
|
Super 6x: RSI, MACD, Stoch, Loxxer, CCI, & Velocity [Loxx] for ThinkOrSwim | Indicators | 62 | |
|
|
Repaints RSI, OBV, MACD, STOCH, CCI, or MFI Divergence For ThinkOrSwim | Indicators | 30 |
Similar threads
-
-
-
-
Super 6x: RSI, MACD, Stoch, Loxxer, CCI, & Velocity [Loxx] for ThinkOrSwim
- Started by samer800
- Replies: 62
-
Repaints RSI, OBV, MACD, STOCH, CCI, or MFI Divergence For ThinkOrSwim
- Started by samer800
- Replies: 30
Not the exact question you're looking for?
Start a new thread and receive assistance from our community.
Similar threads
-
-
-
-
Super 6x: RSI, MACD, Stoch, Loxxer, CCI, & Velocity [Loxx] for ThinkOrSwim
- Started by samer800
- Replies: 62
-
Repaints RSI, OBV, MACD, STOCH, CCI, or MFI Divergence For ThinkOrSwim
- Started by samer800
- Replies: 30
Similar threads
-
-
-
-
Super 6x: RSI, MACD, Stoch, Loxxer, CCI, & Velocity [Loxx] for ThinkOrSwim
- Started by samer800
- Replies: 62
-
Repaints RSI, OBV, MACD, STOCH, CCI, or MFI Divergence For ThinkOrSwim
- Started by samer800
- Replies: 30
The Market Trading Game Changer
- Exclusive indicators
- Proven strategies & setups
- Private Discord community
- ‘Buy The Dip’ signal alerts
- Exclusive members-only content
- Add-ons and resources
- 1 full year of unlimited support
Frequently Asked Questions
useThinkScript is the #1 community of stock market investors using indicators and other tools to power their trading strategies. Traders of all skill levels use our forums to learn about scripting and indicators, help each other, and discover new ways to gain an edge in the markets.
We get it. Our forum can be intimidating, if not overwhelming. With thousands of topics, tens of thousands of posts, our community has created an incredibly deep knowledge base for stock traders. No one can ever exhaust every resource provided on our site.
If you are new, or just looking for guidance, here are some helpful links to get you started.
- The most viewed thread:
https://usethinkscript.com/threads/repainting-trend-reversal-for-thinkorswim.183/ - Our most popular indicator:
https://usethinkscript.com/threads/buy-the-dip-indicator-for-thinkorswim.3553/ - Answers to frequently asked questions:
https://usethinkscript.com/threads/answers-to-commonly-asked-questions.6006/

