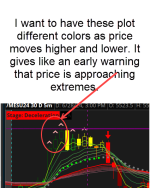
I have 3 different conditions. I want to plot only one based on criteria.
I have Three input factors: High, Medium, Low
I define each
I want to Plot:
I am having trouble understanding how to assign symbols, colors, size, etc., within if statements.
Any help is appreciated.
Don
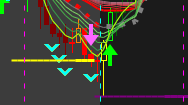
Yes. Trying to plot on the chart.
I have Three input factors: High, Medium, Low
Code:
input FactorHigh = 3.5;
input FactorMedium = 3.0;
input FactorLow = 2.5;
I define each
Code:
def fHigh = close > RSI(factor = FactorHigh);
def fMedium = close < RSI(factor = FactorHigh) and close > RSI(factor = FactorMedium);
def fLow = close < RSI(factor = FactorMedium) and close > RSI(factor = FactorLow);
I want to Plot:
Code:
If fHigh then plot a red square
If fMedium then plot a yellow square
If fLow then plot a green sqaure
I am having trouble understanding how to assign symbols, colors, size, etc., within if statements.
Any help is appreciated.
Don
Yes. Trying to plot on the chart.
Last edited by a moderator: