


MAD HTF CONFLUENCE DASHBOARD
from original script:
https://usethinkscript.com/threads/mad-volatility-trail-backquant-for-thinkorswim.22663/#post-164103
mod note:
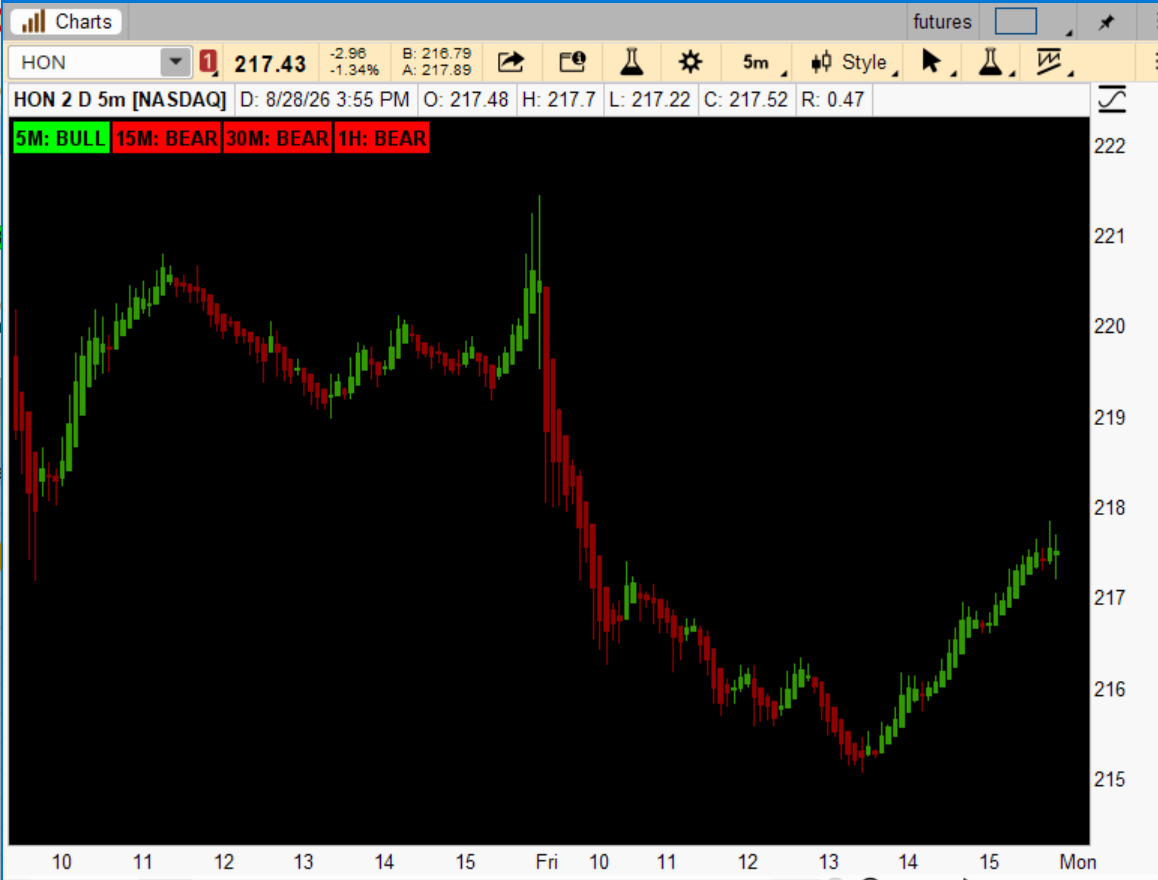
This script acts as a Multi-Timeframe Trend State Matrix built on robust statistics from the original script. It acts purely as an information compression tool: taking complex volatility-adjusted trailing calculations across four timeframes (5M, 15M, 30M, 1H) and outputting them into four clean, real-time dashboard labels.
from original script:
https://usethinkscript.com/threads/mad-volatility-trail-backquant-for-thinkorswim.22663/#post-164103
mod note:
This script acts as a Multi-Timeframe Trend State Matrix built on robust statistics from the original script. It acts purely as an information compression tool: taking complex volatility-adjusted trailing calculations across four timeframes (5M, 15M, 30M, 1H) and outputting them into four clean, real-time dashboard labels.
Code:
# MAD HTF LABELS ONLY - SEPARATE STUDY
# Add as a NEW study alongside the ORIGINAL MAD_Volatility_Trail.
# Remove the previous dashboard add-on from the original study first.
# Use on a 5-minute time chart. Match inputs to your original MAD study.
# Green = bullish. Red = bearish. Matching colors = confluence.
# No signal filtering, arrows, orders, clouds, or candle coloring.
# Default LIVE labels can change before the candle closes.
# Uses close as source and preserves the original rolling-deviation formula.

declare upper;

input showLabels = yes;
input completedBarsOnly = no;
input madLen = 45;
input madScale = 1.4655;
input factor = 1.15;
input useAtrFloor = no;
input atrLen = 14;
input atrFloorMult = 0.2;
input useSlopeConfirm = no;
input slopeLen = 2;

script MADLabelState {
    input agg = AggregationPeriod.FIVE_MIN;
    input n = 45;
    input scale = 1.4655;
    input mult = 1.15;
    input floorOn = no;
    input atrN = 14;
    input floorMult = 0.2;
    input slopeOn = no;
    input slopeN = 2;
    input closedOnly = no;

    def c = close(period = agg);
    def h = high(period = agg);
    def l = low(period = agg);
    def m = Median(c, n);
    def dev = Median(AbsValue(c - m), n);
    def atr = WildersAverage(TrueRange(h, c, l), atrN);
    def width = if floorOn
                then Max(dev * scale * mult, atr * floorMult)
                else dev * scale * mult;
    def upper = m + width;
    def lower = m - width;

    def lowerTrail = CompoundValue(1,
        if !IsNaN(lowerTrail[1]) and c[1] > lowerTrail[1]
        then Max(lower, lowerTrail[1]) else lower, lower);

    def upperTrail = CompoundValue(1,
        if !IsNaN(upperTrail[1]) and c[1] < upperTrail[1]
        then Min(upper, upperTrail[1]) else upper, upper);

    def bullSlope = !slopeOn or m > m[slopeN];
    def bearSlope = !slopeOn or m < m[slopeN];

    def direction = CompoundValue(1,
        if direction[1] == 0 and !IsNaN(m) then
            if c >= m then 1 else -1
        else if c > upperTrail and direction[1] != 1 and bullSlope then 1
        else if c < lowerTrail and direction[1] != -1 and bearSlope then -1
        else direction[1], 0);

    def valid = !IsNaN(width) and !IsNaN(c);
    plot State = if closedOnly
                 then (if valid[1] then direction[1] else 0)
                 else (if valid then direction else 0);
}

def s5 = MADLabelState(
    agg = AggregationPeriod.FIVE_MIN,
    n = madLen, scale = madScale, mult = factor,
    floorOn = useAtrFloor, atrN = atrLen, floorMult = atrFloorMult,
    slopeOn = useSlopeConfirm, slopeN = slopeLen,
    closedOnly = completedBarsOnly).State;

def s15 = MADLabelState(
    agg = AggregationPeriod.FIFTEEN_MIN,
    n = madLen, scale = madScale, mult = factor,
    floorOn = useAtrFloor, atrN = atrLen, floorMult = atrFloorMult,
    slopeOn = useSlopeConfirm, slopeN = slopeLen,
    closedOnly = completedBarsOnly).State;

def s30 = MADLabelState(
    agg = AggregationPeriod.THIRTY_MIN,
    n = madLen, scale = madScale, mult = factor,
    floorOn = useAtrFloor, atrN = atrLen, floorMult = atrFloorMult,
    slopeOn = useSlopeConfirm, slopeN = slopeLen,
    closedOnly = completedBarsOnly).State;

def s60 = MADLabelState(
    agg = AggregationPeriod.HOUR,
    n = madLen, scale = madScale, mult = factor,
    floorOn = useAtrFloor, atrN = atrLen, floorMult = atrFloorMult,
    slopeOn = useSlopeConfirm, slopeN = slopeLen,
    closedOnly = completedBarsOnly).State;

AddLabel(showLabels,
    "5M: " + (if s5 == 1 then "BULL" else if s5 == -1 then "BEAR" else "LOADING"),
    if s5 == 1 then Color.GREEN else if s5 == -1 then Color.RED else Color.GRAY);

AddLabel(showLabels,
    "15M: " + (if s15 == 1 then "BULL" else if s15 == -1 then "BEAR" else "LOADING"),
    if s15 == 1 then Color.GREEN else if s15 == -1 then Color.RED else Color.GRAY);

AddLabel(showLabels,
    "30M: " + (if s30 == 1 then "BULL" else if s30 == -1 then "BEAR" else "LOADING"),
    if s30 == 1 then Color.GREEN else if s30 == -1 then Color.RED else Color.GRAY);

AddLabel(showLabels,
    "1H: " + (if s60 == 1 then "BULL" else if s60 == -1 then "BEAR" else "LOADING"),
    if s60 == 1 then Color.GREEN else if s60 == -1 then Color.RED else Color.GRAY);
Last edited by a moderator:


