
I am trying to compare today's high to the next previous high and determine if its > 2. The next previous high could have been any number of bars ago. I don't want to return the highest all though. Just the next high previous to today's high. anyone have any hints on how to accomplish this?
-
Get $40 off VIP by signing up for a free account! Sign Up
You are using an out of date browser. It may not display this or other websites correctly.
You should upgrade or use an alternative browser.
You should upgrade or use an alternative browser.
how to return the value of the previous high from an undefined length of bars
- Thread starter greco26
- Start date
I am trying to compare today's high to the next previous high and determine if its > 2. The next previous high could have been any number of bars ago. I don't want to return the highest all though. Just the next high previous to today's high. anyone have any hints on how to accomplish this?
This is using 'fold' (someone who is more familiar could likely do better than the following, but it seems to work).

Ruby:input period = 100; def lasthigh = if IsNaN(close[-1]) and !IsNaN(close) then high else Double.NaN; def Data = fold i = 0 to period with price = Double.NaN while IsNaN(price) do if GetValue(high, -i) > HighestAll(lasthigh) then GetValue(high, -i) else Data[1]; def Databar = fold j = 0 to period with p = Double.NaN while IsNaN(p) do if GetValue(high, -j) > HighestAll(lasthigh) then BarNumber() else Double.NaN; AddChartBubble(high == HighestAll(lasthigh), high, high); AddChartBubble(BarNumber() == HighestAll(Databar), high, high); AddLabel(1, "Higher High " + Data + " Last High " + lasthigh, Color.WHITE);
Join useThinkScript to post your question to a community of 21,000+ developers and traders.
this works perfectly. What if I wanted to exclude/skip yesterday's high in this study?
This should exclude the next bar
 Ruby:
Ruby:input period = 100; def lasthigh = if IsNaN(close[-1]) and !IsNaN(close) then high else Double.NaN; def nexthigh = if IsNaN(close[-1]) and !IsNaN(close) then high[1] else Double.NaN; def Data = fold i = 0 to period with price = Double.NaN while IsNaN(price) do if GetValue(high, -i) > HighestAll(lasthigh) and GetValue(high, -i) > HighestAll(nexthigh) then GetValue(high, -i) else Data[1]; def Databar = fold j = 0 to period with p = Double.NaN while IsNaN(p) do if GetValue(high, -j) > HighestAll(lasthigh) and GetValue(high, -j) > HighestAll(nexthigh) then BarNumber() else Double.NaN; AddChartBubble(high == HighestAll(lasthigh), high, high); AddChartBubble(BarNumber() == HighestAll(Databar), high, high); AddLabel(1, "Higher High " + Data + " Last High " + lasthigh, Color.WHITE);
AstroBoy
New member
Hey! I was wondering if you can take a look at this script and give me some pointers, when you have time?This should exclude the next bar
This current script I tweaked from BenTen plots out a line from the current Day's High at the exact candle bar it occurs.
However, I'm wondering how it can be tweaked to plot out a line beginning from Yesterday's High Candle and extends to the right, and doesn't have the price line go any more to left?
Code:
DEF DH = high;
DEF bar = BarNumber();
DEF Today = SecondsFromTime(0930);
DEF Dayhigh = if Today and !Today[1] then DH else if Today and DH > Dayhigh[1] then DH else Dayhigh[1];
DEF DayHighBar = if Today and DH == Dayhigh then bar else Double.NaN;
DEF DayHighest = if BarNumber() == HighestAll(DayHighBar)  then Dayhigh else DayHighest[1];

PLOT DayHigh = if (DayHighest > 0) then DayHighest else Double.NaN;Hey! I was wondering if you can take a look at this script and give me some pointers, when you have time?
This current script I tweaked from BenTen plots out a line from the current Day's High at the exact candle bar it occurs.
However, I'm wondering how it can be tweaked to plot out a line beginning from Yesterday's High Candle and extends to the right, and doesn't have the price line go any more to left?
Code:DEF DH = high; DEF bar = BarNumber(); DEF Today = SecondsFromTime(0930); DEF Dayhigh = if Today and !Today[1] then DH else if Today and DH > Dayhigh[1] then DH else Dayhigh[1]; DEF DayHighBar = if Today and DH == Dayhigh then bar else Double.NaN; DEF DayHighest = if BarNumber() == HighestAll(DayHighBar) then Dayhigh else DayHighest[1]; PLOT DayHigh = if (DayHighest > 0) then DayHighest else Double.NaN;
Try this. Added input Day (0=Today, 1=Yesterday, etc) and getday()==getlastday()-Day and Plot to DayHigh1
 Ruby:
Ruby:def DH = high; def bar = BarNumber(); input Day = 0; def Today = GetDay() == GetLastDay() - Day and SecondsFromTime(0930); def Dayhigh = if Today and !Today[1] then DH else if Today[1] and DH > Dayhigh[1] then DH else Dayhigh[1]; def DayHighBar = if Today and DH == Dayhigh then bar else Double.NaN; def DayHighest = if BarNumber() == HighestAll(DayHighBar) then Dayhigh else DayHighest[1]; plot DayHigh1 = if (DayHighest > 0) then DayHighest else Double.NaN;
I am trying to compare today's high to the next previous high and determine if its > 2. The next previous high could have been any number of bars ago. I don't want to return the highest all though. Just the next high previous to today's high. anyone have any hints on how to accomplish this?
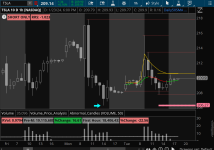
here is another way to find previous highs. it finds the highest high. then it finds the 2 previous highs.
it draws 3 bubbles, with high prices and bar numbers.
you can pick a number for bars back (an offset), which shifts the start x bars back from the last bar number.
if an offset is used, it draws a vertical line, to show the starting bar from which if looks back in time.
i'm not sure what you mean by > 2 , so i didn't do anything for it.
Ruby:
# prevhighest_00

# https://usethinkscript.com/threads/how-to-return-the-value-of-the-previous-high-from-an-undefined-length-of-bars.7355/
# compare today's high to the next previous high and determine if its > 2.

def bn = barnumber();
def na = double.nan;
def hi = high;

input bars_back = 0;

# highest high
def max1val = HighestAll( if isnan(high[-bars_back]) then 0 else high );
def max1bn = HighestAll(if (hi == max1val and !isnan(high[-bars_back])) then bn else 0);

# prev highest
def max2val = HighestAll(if bn < max1bn then hi else 0);
def max2bn = HighestAll(if (hi == max2val and bn < max1bn) then bn else 0);

# prev highest
def max3val = HighestAll(if bn < max2bn then hi else 0);
def max3bn = HighestAll(if (hi == max3val and bn < max2bn) then bn else 0);


addlabel(1, "highest " + max1val + "  " + "highest bar# " + max1bn, color.cyan);
addlabel(1, "prev highest " + max2val + "  " + "prev highest bar# " + max2bn, color.cyan);
addlabel(1, "prev highest " + max3val + "  " + "prev highest bar# " + max3bn, color.cyan);

plot z1 = if bn == max1bn then low else na;
z1.SetPaintingStrategy(PaintingStrategy.ARROW_UP);
z1.SetDefaultColor(Color.yellow);
z1.setlineweight(1);
z1.hidebubble();

plot z2 = if bn == max2bn then low else na;
z2.SetPaintingStrategy(PaintingStrategy.ARROW_UP);
z2.SetDefaultColor(Color.yellow);
z2.setlineweight(1);
z2.hidebubble();

plot z3 = if bn == max3bn then low else na;
z3.SetPaintingStrategy(PaintingStrategy.ARROW_UP);
z3.SetDefaultColor(Color.yellow);
z3.setlineweight(1);
z3.hidebubble();

def x = (bn == max1bn) or (bn == max2bn) or (bn == max3bn);
addchartbubble(x, high * 1.005, high + "\nbar# " + bn, color.gray, yes);

# draw a vertical line if a starting offset is used
def t = !isnan(high[-bars_back]) and isnan(high[-(bars_back+1)]);
addverticalline( (t>0), "starting bar", color.gray, Curve.MEDIUM_DASH);
#
NVDA 2HR . bars back = 144
side note, i wonder if this alternative code for highestall, can be used to replace each instance of highestall ?
with a goal of making it not complex.
https://usethinkscript.com/threads/current-price-line-indicator.6537/#post-63746
with a goal of making it not complex.
https://usethinkscript.com/threads/current-price-line-indicator.6537/#post-63746
@SleepyZ , my brain continues to not want to understand how folds work. I hate to ask for more help from you but I was wondering if you might be able to add comments to different parts of the code describing what each line of the fold means? I want to add more prior highs but I'm not sure how to do it. Every time I add code, it doesn't change the fold the way I expect which means Im still not fundamentally understanding how a fold works. As always, any help you can lend would be just awesome!!This should exclude the next bar
@SleepyZ , my brain continues to not want to understand how folds work. I hate to ask for more help from you but I was wondering if you might be able to add comments to different parts of the code describing what each line of the fold means? I want to add more prior highs but I'm not sure how to do it. Every time I add code, it doesn't change the fold the way I expect which means Im still not fundamentally understanding how a fold works. As always, any help you can lend would be just awesome!!
read through this
https://jshingler.github.io/TOS-and...t Collection.html#the-fold-function-explained
@SleepyZ , my brain continues to not want to understand how folds work. I hate to ask for more help from you but I was wondering if you might be able to add comments to different parts of the code describing what each line of the fold means? I want to add more prior highs but I'm not sure how to do it. Every time I add code, it doesn't change the fold the way I expect which means Im still not fundamentally understanding how a fold works. As always, any help you can lend would be just awesome!!
part of the code from post #2
input period = 100;
def lasthigh = if IsNaN(close[-1]) and !IsNaN(close) then high else Double.NaN;
def Data = fold i = 0 to period
#..on each bar on chart
#..data will be set = to the final result of the fold loop.
#..i counts from 0 to (period-1) , 0 to 99
with price = Double.NaN
#..with, specifies a temporary variable, price.
#..if it is set = to a value, that will be the starting value.
#..If a value is omitted, then the default value is 0
while IsNaN(price)
#..isnan() is true when price is not a valid number.
#..as long as IsNaN(price) is true, stay in loop and evaluate the do line
do
if GetValue(high, -i) > HighestAll(lasthigh)
then GetValue(high, -i)
else Data[1];
#..
#..check if a future high value is greater than the highest value of lasthigh
#..
#..GetValue(high, -i)
#..getvalue is used in fold loops, to read values from a variable, based on an offset. above , as the loop i counts through 0-99, those numbers are used as offsets . equivelants, high[0] , high[-1], high[-2], high[-3], ... since the offset is negative, it is reading values from future bars.
#..
AstroBoy
New member
Try this. Added input Day (0=Today, 1=Yesterday, etc) and getday()==getlastday()-Day and Plot to DayHigh1
Hi @SleepyZ I'm wondering if you can help me with a small bit of ThinkScript? Everything is working perfectly, but I'm trying to draw a line from the Lowest Price of yesterday... it is called "InterdayDoubleBottom" in my script here, but it's not working? I basically just took the InterdayDoubleTop code and reversed it for "Low" instead of "High"... It should work but it isn't.
Code:
INPUT AggregationPeriod = AggregationPeriod.DAY;
INPUT Displace = -1;
INPUT Day = 1;
INPUT Length = 1;
INPUT ShowTodayOnly = yes;


DEF SecondsPassed = SecondsFromTime(1559);
DEF SecondsPassed2 = SecondsFromTime(0930);

DEF DH = high;
DEF Bar = BarNumber();
DEF Today = SecondsFromTime(0930) >= 0 and SecondsPassed <=0 and SecondsPassed2 >=0;
DEF Dayhigh = if Today and !Today[1] then DH else if Today and DH > Dayhigh[1] then DH else Dayhigh[1];
DEF DayHighBar = if Today and DH == Dayhigh then Bar else Double.NaN;
DEF DayHighest = if BarNumber() == HighestAll(DayHighBar)  then Dayhigh else DayHighest[1];
DEF DL = low;
DEF Daylow = if Today and !Today[1] then DL else if Today and  DL < Daylow[1] then DL else Daylow[1];
DEF DaylowBar = if Today and DL == Daylow then Bar else Double.NaN;
DEF DayLowest = if BarNumber() == HighestAll(DaylowBar) then Daylow else DayLowest[1];


PLOT DailyHigh = if (DayHighest >= 0) then DayHighest else Double.NaN;
PLOT DailyLow = if (DayLowest >= 0) then DayLowest else Double.NaN;

DEF YH = high;
DEF YesterdayBar = BarNumber();
DEF Yesterday = (GetDay() == GetLastDay()) - DAY and SecondsPassed <=0 and SecondsPassed2 >=0;
DEF YesterdayHigh = if Yesterday and !Yesterday[1] then YH else if Yesterday and YH > YesterdayHigh[1] then YH else YesterdayHigh[1];
DEF YesterdayHighBar = if Yesterday and YH == YesterdayHigh then YesterdayBar else Double.NaN;
DEF YesterdayHighest = if BarNumber() == HighestAll(YesterdayHighBar)  then YesterdayHigh else YesterdayHighest[1];

PLOT InterdayDoubleTop = if (YesterdayHighest >= 0) and (YesterdayHighest > DailyHigh) then YesterdayHighest else Double.NaN;

DEF YL = low;
DEF YesterdayLow = if Yesterday and !Yesterday[1] then YL else if Yesterday and YL > YesterdayLow[1] then YL else YesterdayLow[1];
DEF YesterdayLowBar = if Yesterday and YL == YesterdayLow then YesterdayBar else Double.NaN;
DEF YesterdayLowest = if BarNumber() == LowestAll(YesterdayLowBar)  then YesterdayLow else YesterdayLowest[1];

PLOT InterdayDoubleBottom = if (YesterdayLowest >= 0) and (YesterdayLowest < DailyLow) then YesterdayHighest else Double.NaN;Hi @SleepyZ I'm wondering if you can help me with a small bit of ThinkScript? Everything is working perfectly, but I'm trying to draw a line from the Lowest Price of yesterday... it is called "InterdayDoubleBottom" in my script here, but it's not working? I basically just took the InterdayDoubleTop code and reversed it for "Low" instead of "High"... It should work but it isn't.
Code:INPUT AggregationPeriod = AggregationPeriod.DAY; INPUT Displace = -1; INPUT Day = 1; INPUT Length = 1; INPUT ShowTodayOnly = yes; DEF SecondsPassed = SecondsFromTime(1559); DEF SecondsPassed2 = SecondsFromTime(0930); DEF DH = high; DEF Bar = BarNumber(); DEF Today = SecondsFromTime(0930) >= 0 and SecondsPassed <=0 and SecondsPassed2 >=0; DEF Dayhigh = if Today and !Today[1] then DH else if Today and DH > Dayhigh[1] then DH else Dayhigh[1]; DEF DayHighBar = if Today and DH == Dayhigh then Bar else Double.NaN; DEF DayHighest = if BarNumber() == HighestAll(DayHighBar) then Dayhigh else DayHighest[1]; DEF DL = low; DEF Daylow = if Today and !Today[1] then DL else if Today and DL < Daylow[1] then DL else Daylow[1]; DEF DaylowBar = if Today and DL == Daylow then Bar else Double.NaN; DEF DayLowest = if BarNumber() == HighestAll(DaylowBar) then Daylow else DayLowest[1]; PLOT DailyHigh = if (DayHighest >= 0) then DayHighest else Double.NaN; PLOT DailyLow = if (DayLowest >= 0) then DayLowest else Double.NaN; DEF YH = high; DEF YesterdayBar = BarNumber(); DEF Yesterday = (GetDay() == GetLastDay()) - DAY and SecondsPassed <=0 and SecondsPassed2 >=0; DEF YesterdayHigh = if Yesterday and !Yesterday[1] then YH else if Yesterday and YH > YesterdayHigh[1] then YH else YesterdayHigh[1]; DEF YesterdayHighBar = if Yesterday and YH == YesterdayHigh then YesterdayBar else Double.NaN; DEF YesterdayHighest = if BarNumber() == HighestAll(YesterdayHighBar) then YesterdayHigh else YesterdayHighest[1]; PLOT InterdayDoubleTop = if (YesterdayHighest >= 0) and (YesterdayHighest > DailyHigh) then YesterdayHighest else Double.NaN; DEF YL = low; DEF YesterdayLow = if Yesterday and !Yesterday[1] then YL else if Yesterday and YL > YesterdayLow[1] then YL else YesterdayLow[1]; DEF YesterdayLowBar = if Yesterday and YL == YesterdayLow then YesterdayBar else Double.NaN; DEF YesterdayLowest = if BarNumber() == LowestAll(YesterdayLowBar) then YesterdayLow else YesterdayLowest[1]; PLOT InterdayDoubleBottom = if (YesterdayLowest >= 0) and (YesterdayLowest < DailyLow) then YesterdayHighest else Double.NaN;
I believe this will now do what you want after correcting these two lines
withDEF YesterdayLow = if Yesterday and !Yesterday[1] then YL else if Yesterday and YL > YesterdayLow[1] then YL else YesterdayLow[1];
PLOT InterdayDoubleBottom = if (YesterdayLowest >= 0) and (YesterdayLowest < DailyLow) then YesterdayHighest else Double.NaN
def YesterdayLow = if Yesterday and !Yesterday[1] then YL else if Yesterday and YL < YesterdayLow[1] then YL else YesterdayLow[1];
plot InterdayDoubleBottom = if (YesterdayLowest >= 0) and (YesterdayLowest < DailyLow) then YesterdayLowest else Double.NaN;
Here is the full code with the above changes
 Code:
Code:input AggregationPeriod = AggregationPeriod.DAY; input Displace = -1; input Day = 1; input Length = 1; input ShowTodayOnly = yes; def SecondsPassed = SecondsFromTime(1559); def SecondsPassed2 = SecondsFromTime(0930); def DH = high; def Bar = BarNumber(); def Today = SecondsFromTime(0930) >= 0 and SecondsPassed <= 0 and SecondsPassed2 >= 0; def Dayhigh = if Today and !Today[1] then DH else if Today and DH > Dayhigh[1] then DH else Dayhigh[1]; def DayHighBar = if Today and DH == Dayhigh then Bar else Double.NaN; def DayHighest = if BarNumber() == HighestAll(DayHighBar) then Dayhigh else DayHighest[1]; def DL = low; def Daylow = if Today and !Today[1] then DL else if Today and DL < Daylow[1] then DL else Daylow[1]; def DaylowBar = if Today and DL == Daylow then Bar else Double.NaN; def DayLowest = if BarNumber() == HighestAll(DaylowBar) then Daylow else DayLowest[1]; plot DailyHigh = if (DayHighest >= 0) then DayHighest else Double.NaN; plot DailyLow = if (DayLowest >= 0) then DayLowest else Double.NaN; def YH = high; def YesterdayBar = BarNumber(); def Yesterday = (GetDay() == GetLastDay()) - Day and SecondsPassed <= 0 and SecondsPassed2 >= 0; def YesterdayHigh = if Yesterday and !Yesterday[1] then YH else if Yesterday and YH > YesterdayHigh[1] then YH else YesterdayHigh[1]; def YesterdayHighBar = if Yesterday and YH == YesterdayHigh then YesterdayBar else Double.NaN; def YesterdayHighest = if BarNumber() == HighestAll(YesterdayHighBar) then YesterdayHigh else YesterdayHighest[1]; plot InterdayDoubleTop = if (YesterdayHighest >= 0) and (YesterdayHighest > DailyHigh) then YesterdayHighest else Double.NaN; def YL = low; def YesterdayLow = if Yesterday and !Yesterday[1] then YL else if Yesterday and YL < YesterdayLow[1] then YL else YesterdayLow[1]; def YesterdayLowBar = if Yesterday and YL == YesterdayLow then YesterdayBar else Double.NaN; def YesterdayLowest = if BarNumber() == HighestAll(YesterdayLowBar) then YesterdayLow else YesterdayLowest[1]; plot InterdayDoubleBottom = if (YesterdayLowest >= 0) and (YesterdayLowest < DailyLow) then YesterdayLowest else Double.NaN;
AstroBoy
New member
I believe this will now do what you want after correcting these two lines
with
Here is the full code with the above changes
Thank you! I can't believe it was that simple...
Can you help me better understand why the ThinkScript doesn't draw the line starting from the yesterday low candle, but it does with the yesterday high candle? Because it looks like all we did, was just "reverse" the think script we used for yesterday high, and applied it for the low... I also tried using "LowestAll" but that doesn't seem to work at all.
Attached is a screenshot of what I mean, with a blue arrow pointing to where it should have been.
Attachments
AstroBoy
New member
@SleepyZ Hi! Just wanted to follow-up again to revisit this; I played around with different versions of this to draw a line FROM the lowest candle, but it still doesn't work, even though we simply made some small modifications. Any advice?[...]
Can you help me better understand why the ThinkScript doesn't draw the line starting from the yesterday low candle, but it does with the yesterday high candle? Because it looks like all we did, was just "reverse" the think script we used for yesterday high, and applied it for the low... [...]
@SleepyZ Hi! Just wanted to follow-up again to revisit this; I played around with different versions of this to draw a line FROM the lowest candle, but it still doesn't work, even though we simply made some small modifications. Any advice?
The reason that the InterdayDoubleBottom did not plot was because I did not change the code you provided. The lines plotted by commenting out the bold portions below, which restricted the plots, unless met.
Yesterday's high plotted because it was greater than Daily high.
Yesterday's low did not plot because it was greater than the Daily low.
I added horizontal lines forr the Daily and dashed lines for Yesterday in the full code below
I did not fix the ShowTodayOnly since your original code did not use it.
plot InterdayDoubleTop = if (YesterdayHighest >= 0) #and (YesterdayHighest > DailyHigh)
then YesterdayHighest else Double.NaN;
plot InterdayDoubleBottom = if (YesterdayLowest >= 0) #and (YesterdayLowest < DailyLow)
then YesterdayLowest else Double.NaN;
Full Code
 Code:
Code:input AggregationPeriod = AggregationPeriod.DAY; input Displace = -1; input Day = 1; input Length = 1; input ShowTodayOnly = yes; def SecondsPassed = SecondsFromTime(1559); def SecondsPassed2 = SecondsFromTime(0930); def DH = high; def Bar = BarNumber(); def Today = SecondsFromTime(0930) >= 0 and SecondsPassed <= 0 and SecondsPassed2 >= 0; def Dayhigh = if Today and !Today[1] then DH else if Today and DH > Dayhigh[1] then DH else Dayhigh[1]; def DayHighBar = if Today and DH == Dayhigh then Bar else Double.NaN; def DayHighest = if BarNumber() == HighestAll(DayHighBar) then Dayhigh else DayHighest[1]; def DL = low; def Daylow = if Today and !Today[1] then DL else if Today and DL < Daylow[1] then DL else Daylow[1]; def DaylowBar = if Today and DL == Daylow then Bar else Double.NaN; def DayLowest = if BarNumber() == HighestAll(DaylowBar) then Daylow else DayLowest[1]; plot DailyHigh = if (DayHighest >= 0) then DayHighest else Double.NaN; plot DailyLow = if (DayLowest >= 0) then DayLowest else Double.NaN; DailyHigh.setpaintingStrategy(paintingStrategy.HORIZONTAL); DailyLow.setpaintingStrategy(paintingStrategy.HORIZONTAL); def YH = high; def YesterdayBar = BarNumber(); def Yesterday = (GetDay() == GetLastDay()) - Day and SecondsPassed <= 0 and SecondsPassed2 >= 0; def YesterdayHigh = if Yesterday and !Yesterday[1] then YH else if Yesterday and YH > YesterdayHigh[1] then YH else YesterdayHigh[1]; def YesterdayHighBar = if Yesterday and YH == YesterdayHigh then YesterdayBar else Double.NaN; def YesterdayHighest = if BarNumber() == HighestAll(YesterdayHighBar) then YesterdayHigh else YesterdayHighest[1]; plot InterdayDoubleTop = if (YesterdayHighest >= 0) #and (YesterdayHighest > DailyHigh) then YesterdayHighest else Double.NaN; InterdayDoubleTop.setpaintingStrategy(paintingStrategy.DASHES); def YL = low; def YesterdayLow = if Yesterday and !Yesterday[1] then YL else if Yesterday and YL < YesterdayLow[1] then YL else YesterdayLow[1]; def YesterdayLowBar = if Yesterday and YL == YesterdayLow then YesterdayBar else Double.NaN; def YesterdayLowest = if BarNumber() == HighestAll(YesterdayLowBar) then YesterdayLow else YesterdayLowest[1]; plot InterdayDoubleBottom = if (YesterdayLowest >= 0) #and (YesterdayLowest < DailyLow) then YesterdayLowest else Double.NaN; InterdayDoubleBottom.setpaintingStrategy(paintingStrategy.DASHES); #
| Thread starter | Similar threads | Forum | Replies | Date |
|---|---|---|---|---|
| S | Can TS return value for Market Buys and Market Sells? | Questions | 2 | |
| G | Scan for Return on Capital Employed | Questions | 1 | |
| A | Scan to return results of companies based on country | Questions | 2 | |
| K | GetStrike() in Option Chains return NaN | Questions | 2 | |
| G | Tricking daily watchlist column to return prior months high | Questions | 7 |
Similar threads
Not the exact question you're looking for?
Start a new thread and receive assistance from our community.
87k+
Posts
348
Online
Similar threads
Similar threads
The Market Trading Game Changer
Join 2,500+ subscribers inside the useThinkScript VIP Membership Club
- Exclusive indicators
- Proven strategies & setups
- Private Discord community
- ‘Buy The Dip’ signal alerts
- Exclusive members-only content
- Add-ons and resources
- 1 full year of unlimited support
Frequently Asked Questions
What is useThinkScript?
useThinkScript is the #1 community of stock market investors using indicators and other tools to power their trading strategies. Traders of all skill levels use our forums to learn about scripting and indicators, help each other, and discover new ways to gain an edge in the markets.
How do I get started?
We get it. Our forum can be intimidating, if not overwhelming. With thousands of topics, tens of thousands of posts, our community has created an incredibly deep knowledge base for stock traders. No one can ever exhaust every resource provided on our site.
If you are new, or just looking for guidance, here are some helpful links to get you started.
- The most viewed thread:
https://usethinkscript.com/threads/repainting-trend-reversal-for-thinkorswim.183/ - Our most popular indicator:
https://usethinkscript.com/threads/buy-the-dip-indicator-for-thinkorswim.3553/ - Answers to frequently asked questions:
https://usethinkscript.com/threads/answers-to-commonly-asked-questions.6006/
What are the benefits of VIP Membership?
VIP members get exclusive access to these proven and tested premium indicators: Buy the Dip, Advanced Market Moves 2.0, Take Profit, and Volatility Trading Range. In addition, VIP members get access to over 50 VIP-only custom indicators, add-ons, and strategies, private VIP-only forums, private Discord channel to discuss trades and strategies in real-time, customer support, trade alerts, and much more. Learn all about VIP membership here.
How can I access the premium indicators?
To access the premium indicators, which are plug and play ready, sign up for VIP membership here.