vague questions like this is why i rewrite rules, and sometimes ask a person to rethink and rewrite.
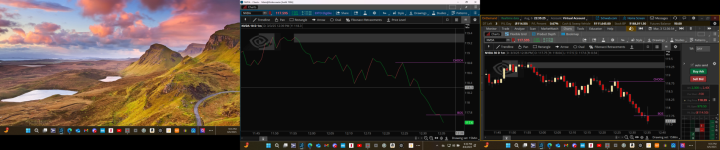
when you say line chart, what are you really asking for? a line connecting the close price on each bar.
this is a programming site, so my 1st thought is a study.
and what study does this?
the default one that shows up when you create a study.
plot Data = close;
This is what i was looking for...
def isGreen = close > open;
def isRed = close < open;
# We create a series that holds the value to plot:
# For green candle, use high
# For red candle, use low
# If candle is doji (close == open), we carry forward previous value
def plotValue = if isGreen then high else if isRed then low else Double.NaN;
# Because we want to connect points sequentially, fill in NaNs by previous value to avoid breaks
rec filledPlotValue = if !IsNaN(plotValue) then plotValue else filledPlotValue[1];
plot connectingLine = filledPlotValue;
connectingLine.SetDefaultColor(Color.CYAN);
connectingLine.SetLineWeight(2);
connectingLine.SetStyle(Curve.FIRM);
connectingLine.HideBubble();
connectingLine.HideTitle();