You should upgrade or use an alternative browser.
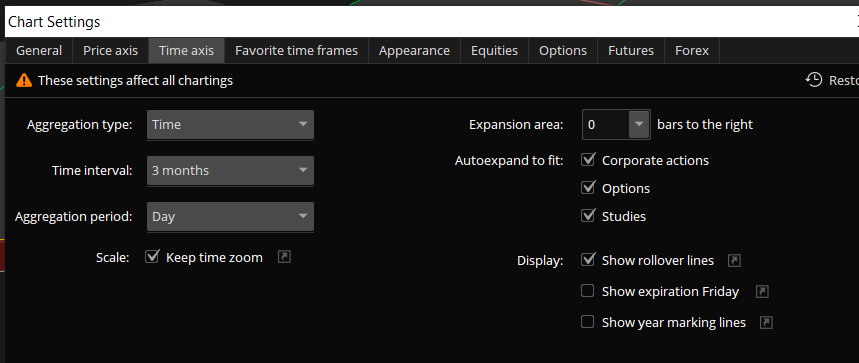
how to get rid of additional space on the right side of chart even though expansion is set to 0?
- Thread starter c0der
- Start date
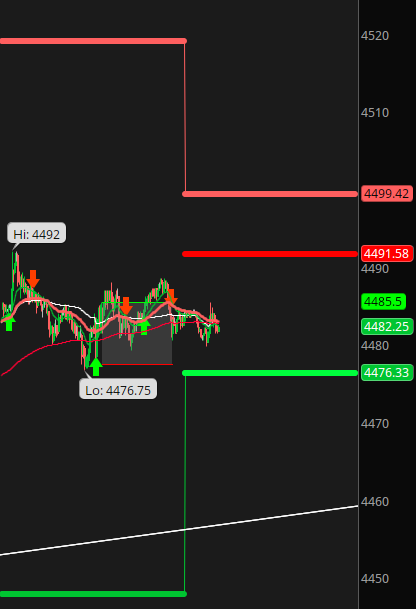
As per image below.
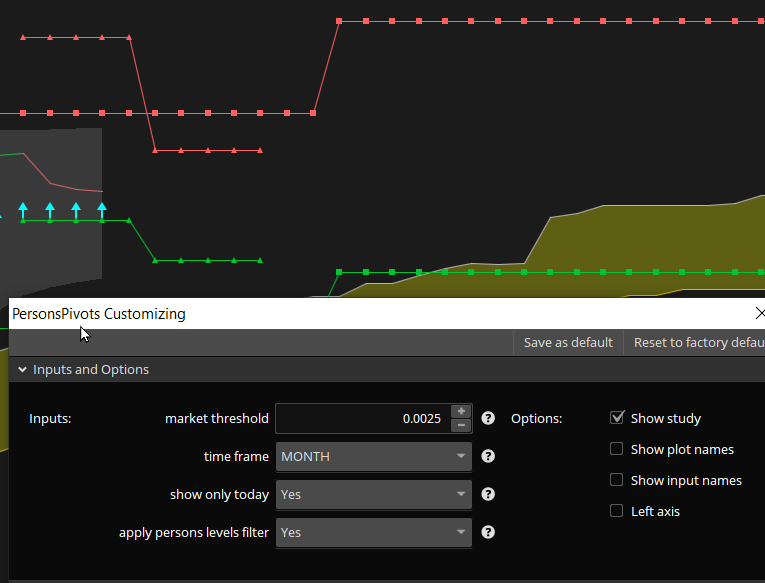
My personspivots is "jutting out" even though I selected "show today only".
As such, only half the space is used even when it's part of a small grid.

This standard script needs to be modified to do what you want. Make a copy of the script and make the addition to the pp definition in bold and italics. The script below has this change.
PP = if isnan(close) then double.nan else (high(period = timeFrame)[1] + low(period = timeFrame)[1] + close(period = timeFrame)[1]) / 3;
R1 = 2 * PP - low(period = timeFrame)[1]l;
 Ruby:
Ruby:# # TD Ameritrade IP Company, Inc. (c) 2008-2021 # input marketThreshold = 0.0025; input timeFrame = {default DAY, "2 DAYS", "3 DAYS", "4 DAYS", WEEK, MONTH, "OPT EXP", QUARTER, YEAR}; input showOnlyToday = no; input applyPersonsLevelsFilter = yes; assert(marketThreshold >= 0, "'market threshold' must not be negative: " + marketThreshold); def marketType = {default DISABLED, NEUTRAL, BEARISH, BULLISH}; def PP2 = high(period = timeFrame)[2] + low(period = timeFrame)[2] + close(period = timeFrame)[2]; marketType = if !applyPersonsLevelsFilter then marketType.DISABLED else if PP2[-1] > (PP2[-1] + PP2 + PP2[1]) / 3 + marketThreshold then marketType.BULLISH else if PP2[-1] < (PP2[-1] + PP2 + PP2[1]) / 3 - marketThreshold then marketType.BEARISH else marketType.NEUTRAL; plot R3; plot R2; plot R1; plot RR; plot PP; plot SS; plot S1; plot S2; plot S3; if showOnlyToday and !IsNaN(close(period = timeFrame)[-1]) then { R1 = Double.NaN; R2 = Double.NaN; R3 = Double.NaN; PP = Double.NaN; S1 = Double.NaN; S2 = Double.NaN; S3 = Double.NaN; } else { PP = if isnan(close) then double.nan else (high(period = timeFrame)[1] + low(period = timeFrame)[1] + close(period = timeFrame)[1]) / 3; R1 = 2 * PP - low(period = timeFrame)[1]; R2 = PP + high(period = timeFrame)[1] - low(period = timeFrame)[1]; R3 = R2 + high(period = timeFrame)[1] - low(period = timeFrame)[1]; S1 = 2 * PP - high(period = timeFrame)[1]; S2 = PP - high(period = timeFrame)[1] + low(period = timeFrame)[1]; S3 = S2 - high(period = timeFrame)[1] + low(period = timeFrame)[1]; } RR = if (marketType == marketType.BEARISH or marketType == marketType.NEUTRAL) then R1 else R2; SS = if (marketType == marketType.BULLISH or marketType == marketType.NEUTRAL) then S1 else S2; RR.setHiding(!applyPersonsLevelsFilter); R1.setHiding(applyPersonsLevelsFilter); R2.setHiding(applyPersonsLevelsFilter); R3.hide(); SS.setHiding(!applyPersonsLevelsFilter); S1.setHiding(applyPersonsLevelsFilter); S2.setHiding(applyPersonsLevelsFilter); S3.hide(); PP.SetDefaultColor(GetColor(0)); R1.SetDefaultColor(GetColor(5)); R2.SetDefaultColor(GetColor(5)); R3.SetDefaultColor(GetColor(5)); S1.SetDefaultColor(GetColor(6)); S2.SetDefaultColor(GetColor(6)); S3.SetDefaultColor(GetColor(6)); SS.DefineColor("S1", GetColor(6)); SS.DefineColor("S2", GetColor(6)); SS.AssignValueColor(if SS == S1 then SS.color("S1") else SS.color("S2")); RR.DefineColor("R1", GetColor(5)); RR.DefineColor("R2", GetColor(5)); RR.AssignValueColor(if RR == R1 then RR.color("R1") else RR.color("R2")); PP.SetStyle(Curve.SHORT_DASH); RR.SetStyle(Curve.SHORT_DASH); R1.SetStyle(Curve.SHORT_DASH); R2.SetStyle(Curve.SHORT_DASH); R3.SetStyle(Curve.SHORT_DASH); SS.SetStyle(Curve.SHORT_DASH); S1.SetStyle(Curve.SHORT_DASH); S2.SetStyle(Curve.SHORT_DASH); S3.SetStyle(Curve.SHORT_DASH); def paintingStrategy = if timeframe == timeframe.WEEK then PaintingStrategy.LINE_VS_TRIANGLES else if timeFrame == timeFrame.MONTH or timeFrame == timeFrame."OPT EXP" or timeFrame == timeFrame.QUARTER or timeFrame == timeFrame.YEAR then PaintingStrategy.LINE_VS_SQUARES else PaintingStrategy.LINE_VS_POINTS; PP.SetPaintingStrategy(paintingStrategy); RR.SetPaintingStrategy(paintingStrategy); R1.SetPaintingStrategy(paintingStrategy); R2.SetPaintingStrategy(paintingStrategy); R3.SetPaintingStrategy(paintingStrategy); SS.SetPaintingStrategy(paintingStrategy); S1.SetPaintingStrategy(paintingStrategy); S2.SetPaintingStrategy(paintingStrategy); S3.SetPaintingStrategy(paintingStrategy);
Same adjustment to ichimokuHi you're right, my ichimoku (default script) is taking up half the space too. How do I get it to only take max 5 bars ahead?
Ruby:# # TD Ameritrade IP Company, Inc. (c) 2007-2021 # input tenkan_period = 9; input kijun_period = 26; plot Tenkan = if isnan(close) then double.nan else (Highest(high, tenkan_period) + Lowest(low, tenkan_period)) / 2; plot Kijun = if isnan(close) then double.nan else (Highest(high, kijun_period) + Lowest(low, kijun_period)) / 2; plot "Span A" = if isnan(close) then double.nan else (Tenkan[kijun_period] + Kijun[kijun_period]) / 2; plot "Span B" = if isnan(close) then double.nan else (Highest(high[kijun_period], 2 * kijun_period) + Lowest(low[kijun_period], 2 * kijun_period)) / 2; plot Chikou = if isnan(close) then double.nan else close[-kijun_period]; Tenkan.SetDefaultColor(GetColor(1)); Kijun.SetDefaultColor(GetColor(2)); "Span A".SetDefaultColor(GetColor(3)); "Span B".SetDefaultColor(GetColor(4)); Chikou.SetDefaultColor(GetColor(5)); DefineGlobalColor("Bullish", Color.YELLOW); DefineGlobalColor("Bearish", Color.RED); AddCloud("Span A", "Span B", globalColor("Bullish"), globalColor("Bearish"));
You're welcome. If you want the 5 bar limit, the following will work.works perfectly. thank you so much!
Ruby:def lastbar = highestall(if !isnan(close) then barnumber() else 0); input barsinexpansion = 5; plot Tenkan = if barnumber()>=lastbar+barsinexpansion then double.nan else (Highest(high, tenkan_period) + Lowest(low, tenkan_period)) / 2; plot Kijun = if barnumber()>=lastbar+barsinexpansion then double.nan else (Highest(high, kijun_period) + Lowest(low, kijun_period)) / 2; plot "Span A" =if barnumber()>=lastbar+barsinexpansion then double.nan else (Tenkan[kijun_period] + Kijun[kijun_period]) / 2; plot "Span B" =if barnumber()>=lastbar+barsinexpansion then double.nan else (Highest(high[kijun_period], 2 * kijun_period) + Lowest(low[kijun_period], 2 * kijun_period)) / 2; plot Chikou = if barnumber()>=lastbar+barsinexpansion then double.nan else close[-kijun_period];
Hi @SleepyZ,This standard script needs to be modified to do what you want. Make a copy of the script and make the addition to the pp definition in bold and italics. The script below has this change.
PP = if isnan(close) then double.nan else (high(period = timeFrame)[1] + low(period = timeFrame)[1] + close(period = timeFrame)[1]) / 3;
R1 = 2 * PP - low(period = timeFrame)[1]l;
May I know if I can do the same for Classic Pivot Points? I tried pasting it but nothing appears:
If I use the default pivot points (together with personspivots without space), there's still a huge expansion on the right.

#
# TD Ameritrade IP Company, Inc. (c) 2011-2021
#
# Source code isn't available.

input showOnlyToday = No;
input timeFrame = {default "DAY", "WEEK", "MONTH"};

plot R3 = Double.NaN;
plot R2 = Double.NaN;
plot R1 = Double.NaN;
plot PP = Double.NaN;
plot S1 = Double.NaN;
plot S2 = Double.NaN;
plot S3 = Double.NaN;input showOnlyToday = No;
input timeFrame = {default "DAY", "WEEK", "MONTH"};
plot R3 = if isnan(close) then double.nan else pivotpoints(showOnlyToday = showOnlyToday, timeFrame = timeFrame).r3;
plot R2 = if isnan(close) then double.nan else pivotpoints(showOnlyToday = showOnlyToday, timeFrame = timeFrame).r2;
plot R1 = if isnan(close) then double.nan else pivotpoints(showOnlyToday = showOnlyToday, timeFrame = timeFrame).r1;
plot PP = if isnan(close) then double.nan else pivotpoints(showOnlyToday = showOnlyToday, timeFrame = timeFrame).pp;
plot S1 = if isnan(close) then double.nan else pivotpoints(showOnlyToday = showOnlyToday, timeFrame = timeFrame).s1;
plot S2 = if isnan(close) then double.nan else pivotpoints(showOnlyToday = showOnlyToday, timeFrame = timeFrame).s2;
plot S3 = if isnan(close) then double.nan else pivotpoints(showOnlyToday = showOnlyToday, timeFrame = timeFrame).s3;@c0der This might work. Since the source code is hidden, you have to reference each individual plot
Code:input showOnlyToday = No; input timeFrame = {default "DAY", "WEEK", "MONTH"}; plot R3 = if isnan(close) then double.nan else pivotpoints(showOnlyToday = showOnlyToday, timeFrame = timeFrame).r3; plot R2 = if isnan(close) then double.nan else pivotpoints(showOnlyToday = showOnlyToday, timeFrame = timeFrame).r2; plot R1 = if isnan(close) then double.nan else pivotpoints(showOnlyToday = showOnlyToday, timeFrame = timeFrame).r1; plot PP = if isnan(close) then double.nan else pivotpoints(showOnlyToday = showOnlyToday, timeFrame = timeFrame).pp; plot S1 = if isnan(close) then double.nan else pivotpoints(showOnlyToday = showOnlyToday, timeFrame = timeFrame).s1; plot S2 = if isnan(close) then double.nan else pivotpoints(showOnlyToday = showOnlyToday, timeFrame = timeFrame).s2; plot S3 = if isnan(close) then double.nan else pivotpoints(showOnlyToday = showOnlyToday, timeFrame = timeFrame).s3;
Here is Pensar's code above with some style code added
Ruby:input showOnlyToday = No; input timeFrame = {default "DAY", "WEEK", "MONTH"}; input lineweight = 2; plot R3 = if isnan(close) then double.nan else pivotpoints(showOnlyToday = showOnlyToday, timeFrame = timeFrame).r3; plot R2 = if isnan(close) then double.nan else pivotpoints(showOnlyToday = showOnlyToday, timeFrame = timeFrame).r2; plot R1 = if isnan(close) then double.nan else pivotpoints(showOnlyToday = showOnlyToday, timeFrame = timeFrame).r1; plot PP = if isnan(close) then double.nan else pivotpoints(showOnlyToday = showOnlyToday, timeFrame = timeFrame).pp; plot S1 = if isnan(close) then double.nan else pivotpoints(showOnlyToday = showOnlyToday, timeFrame = timeFrame).s1; plot S2 = if isnan(close) then double.nan else pivotpoints(showOnlyToday = showOnlyToday, timeFrame = timeFrame).s2; plot S3 = if isnan(close) then double.nan else pivotpoints(showOnlyToday = showOnlyToday, timeFrame = timeFrame).s3; R3.SetDefaultColor(Color.MAGENTA); R2.SetDefaultColor(Color.MAGENTA); R1.SetDefaultColor(Color.MAGENTA); PP.SetDefaultColor(Color.CYAN); S1.SetDefaultColor(Color.MAGENTA); S2.SetDefaultColor(Color.MAGENTA); S3.SetDefaultColor(Color.MAGENTA); R3.SetPaintingStrategy(PaintingStrategy.HORIZONTAL); R2.SetPaintingStrategy(PaintingStrategy.HORIZONTAL); R1.SetPaintingStrategy(PaintingStrategy.HORIZONTAL); PP.SetPaintingStrategy(PaintingStrategy.HORIZONTAL); S1.SetPaintingStrategy(PaintingStrategy.HORIZONTAL); S2.SetPaintingStrategy(PaintingStrategy.HORIZONTAL); S3.SetPaintingStrategy(PaintingStrategy.HORIZONTAL); def paintingStrategy = if timeFrame == timeFrame."DAY" then PaintingStrategy.POINTS else if timeFrame == timeFrame."WEEK" then PaintingStrategy.TRIANGLES else PaintingStrategy.SQUARES; R3.SetPaintingStrategy(paintingStrategy); R2.SetPaintingStrategy(paintingStrategy); R1.SetPaintingStrategy(paintingStrategy); PP.SetPaintingStrategy(paintingStrategy); S1.SetPaintingStrategy(paintingStrategy); S2.SetPaintingStrategy(paintingStrategy); S3.SetPaintingStrategy(paintingStrategy); R3.Setlineweight(lineweight); R2.Setlineweight(lineweight); R1.Setlineweight(lineweight); PP.Setlineweight(lineweight); S1.Setlineweight(lineweight); S2.Setlineweight(lineweight); S3.Setlineweight(lineweight);
Join useThinkScript to post your question to a community of 21,000+ developers and traders.
Similar threads
-
How to get rid of additional/ unnecessary info on study label?
- Started by c0der
- Replies: 10
-
-
-
-
Daily MA on 1m chart need to add some code for additional adjustments
- Started by Wes
- Replies: 1
Not the exact question you're looking for?
Start a new thread and receive assistance from our community.
Similar threads
-
How to get rid of additional/ unnecessary info on study label?
- Started by c0der
- Replies: 10
-
-
-
-
Daily MA on 1m chart need to add some code for additional adjustments
- Started by Wes
- Replies: 1
Similar threads
-
How to get rid of additional/ unnecessary info on study label?
- Started by c0der
- Replies: 10
-
-
-
-
Daily MA on 1m chart need to add some code for additional adjustments
- Started by Wes
- Replies: 1
The Market Trading Game Changer
- Exclusive indicators
- Proven strategies & setups
- Private Discord community
- ‘Buy The Dip’ signal alerts
- Exclusive members-only content
- Add-ons and resources
- 1 full year of unlimited support
Frequently Asked Questions
useThinkScript is the #1 community of stock market investors using indicators and other tools to power their trading strategies. Traders of all skill levels use our forums to learn about scripting and indicators, help each other, and discover new ways to gain an edge in the markets.
We get it. Our forum can be intimidating, if not overwhelming. With thousands of topics, tens of thousands of posts, our community has created an incredibly deep knowledge base for stock traders. No one can ever exhaust every resource provided on our site.
If you are new, or just looking for guidance, here are some helpful links to get you started.
- The most viewed thread:
https://usethinkscript.com/threads/repainting-trend-reversal-for-thinkorswim.183/ - Our most popular indicator:
https://usethinkscript.com/threads/buy-the-dip-indicator-for-thinkorswim.3553/ - Answers to frequently asked questions:
https://usethinkscript.com/threads/answers-to-commonly-asked-questions.6006/


