
You should upgrade or use an alternative browser.
How to draw a 15min Horizontal line of the high & low of the first 15mins after stock market opens
- Thread starter d3lana
- Start date
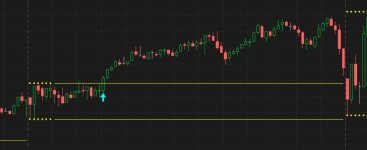
what you are asking for is an ORB studyHi,
Can some please assist on a TOS code to draw a horizontal line of the high & low of the first 15mins candlestick after the stock market opens please? Much thanks!
P.S. I do NOT know much about coding
https://usethinkscript.com/search/1840985/?q=orb&o=date
here is one i made
change the time to 15min
it draws an arrow when a line is crossed
#orbs_05_cln
#http://tos.mx/qJhPhgr

# halcyonguy
# 2021-09
# ORB, opening range levels

def na = Double.NaN;
input timeframe = { t1min , t2min , t3min , t5min , t10min , t15min , default t30min };
input show_ORB_label = yes;
input show_range_lines = no;
def srl = show_range_lines;

input orb_range_lines_pricepercent = 16;
# % of the...what you are asking for is an ORB studyHi,
Can some please assist on a TOS code to draw a horizontal line of the high & low of the first 15mins candlestick after the stock market opens please? Much thanks!
P.S. I do NOT know much about coding
https://usethinkscript.com/search/1840985/?q=orb&o=date
here is one i made
change the time to 15min
it draws an arrow when a line is crossed
#orbs_05_cln
#http://tos.mx/qJhPhgr

# halcyonguy
# 2021-09
# ORB, opening range levels

def na = Double.NaN;
input timeframe = { t1min , t2min , t3min , t5min , t10min , t15min , default t30min };
input show_ORB_label = yes;
input show_range_lines = no;
def srl = show_range_lines;

input orb_range_lines_pricepercent = 16;
# % of the diff of upper line - lower line
def olpp = orb_range_lines_pricepercent;
input show_arrows = yes;
def period = AggregationPeriod.day;

# open/close times  (ET)
input start = 0930;
input end = 1600;
def daytime = if secondsfromTime(start) >= 0 and secondstillTime(end) > 0 then 1 else 0;

def agg;
def per;
switch (timeframe) {
# add  t1min , t2min , t3min , t4min ,
case t1min:
    agg = AggregationPeriod.MIN;
    per = 1;
case t2min:
    agg = AggregationPeriod.two_MIN;
    per = 2;
case t3min:
    agg = AggregationPeriod.three_MIN;
    per = 3;
#case t4min:
#    agg = AggregationPeriod.FOUR_MIN;
#    per = 4;
case t5min:
    agg = AggregationPeriod.fIVE_MIN;
    per = 5;
case t10min:
    agg = AggregationPeriod.Ten_MIN;
    per = 10;
case t15min:
    agg = AggregationPeriod.FIFTEEN_MIN;
    per = 15;
#case t20min:
#    agg = AggregationPeriod.FIFTEEN_MIN;
#    per = 20;
case t30min:
    agg = AggregationPeriod.THIRTY_MIN;
    per = 30;

#case t60min:
#    agg = AggregationPeriod.hOUR;
#    per = 60;
#default:
# agg = aggregationPeriod.FIFTEEN_MIN;
}


addlabel(show_ORB_label, per + " ORB" , color.cyan);


# get candle width , seconds , timeframe
#def getaggmin = round(getaggregationPeriod()/60,0);
def getgg = getaggregationPeriod();
def getaggmin = round(getgg/60,0);

# test if agg time is > than chart time
def aggok = if (getaggmin*60) <= agg then 1 else 0;

def durationsec = per * 60;
def secondspassed = secondsfromTime(start);
#  simulated firstbar , based on orb time
def firstbar = if secondspassed >= 0 and secondspassed < durationsec then 1 else 0;
#addchartbubble(yes,low,per + "__" + firstbar + "__" + agg);
def afterfirst = if ( daytime and !firstbar ) then 1 else 0;

# is this the first bar after open ?
def openbar = if secondspassed >= 0 and secondspassed <= getgg then 1 else 0;

def ehi = high(period = agg);
def elo = low(period = agg);

#  looks at firstbar ,  which is orbtime ,  NOT bar[1]
def perhigh = if !daytime then na else if firstbar then ehi else perhigh[1];
def perlow = if !daytime then na else if firstbar then elo else perlow[1];
# .....................................................

# calc % tolerance levels within orb lines
# def olpp = orblines_pricepercent;
def linediff = perhigh - perlow;
def orbperamt = linediff * (olpp/100);
def orbupperper = perhigh - orbperamt;
def orblowerper = perlow + orbperamt;

def upperrng = if ( close < perhigh and close > orbupperper) then 1 else 0;
def lowerrng = if ( close > perlow and close < orblowerper) then 1 else 0;

addlabel(upperrng,"upper range", color.green);
addlabel(lowerrng,"lower range", color.red);

# def srl = show_range_lines;
# draw lines at x% within orb lines
# plot dots for first bar timeframe
plot hiperdots = if (srl and daytime) then orbupperper else na;
plot loperdots = if (srl and daytime) then orblowerper else na;
hiperdots.setpaintingStrategy(paintingStrategy.points);
loperdots.setpaintingStrategy(paintingStrategy.pointS);
hiperdots.setDefaultColor(color.violet);
loperdots.setDefaultColor(color.violet);
hiperdots.hidebubble();
loperdots.hidebubble();

# .....................................................

# add label if beyond orb range
addlabel((close > perhigh),"above upper line", color.green);
addlabel((close < perlow),"below lower line", color.red);

# .....................................................

# plot dots for first bar timeframe
plot hidots = if firstbar then perhigh else na;
plot lodots = if firstbar then perlow else na;
hidots.setpaintingStrategy(paintingStrategy.points);
lodots.setpaintingStrategy(paintingStrategy.pointS);
hidots.setDefaultColor(color.yellow);
lodots.setDefaultColor(color.yellow);


# plot line after first bar
plot hiline = if !firstbar then perhigh else na;
plot loline = if !firstbar then perlow else na;
hiline.setpaintingStrategy(paintingStrategy.line);
loline.setpaintingStrategy(paintingStrategy.line);
hiline.setDefaultColor(color.yellow);
loline.setDefaultColor(color.yellow);

def afterabove = if (show_arrows and (close crosses above perhigh)) then 1 else 0;
def afterbelow = if (show_arrows and (close crosses below perlow)) then 1 else 0;

# plot arrows on crossover points
def vfac5 = .0014;
plot upline = if afterabove then min( low , (hiline * (1 - vfac5))) else na;
plot dwnline = if afterbelow then max(high, (loline * (1 + vfac5))) else na;
upline.setPaintingStrategy(paintingStrategy.ARROW_UP);
dwnline.setPaintingStrategy(paintingStrategy.ARROW_down);
upline.setDefaultColor(color.cyan);
dwnline.setDefaultColor(color.cyan);
upline.setlineWeight(4);
dwnline.setlineWeight(4);
upline.hideBubble();
dwnline.hideBubble();
#
Attachments
IHopeToLearn
New member
Hi, I love this. Of course I started to customize it for me and I added a chart label that measured the gap between the High and the Low, sort of a ATR. Then (and this is where I really need your opinion on this) to have a second ORB at the 12:30 - 1:30 time, however it just doesn't seem to work, I'm sure it's me. I'm thinking much like a Anchored Vwap. We need to adjust our game for the afternoon. Does this make sense and if it does could you help with this code because for some reason the dots don't line up with the plotted lines and I noticed if I change the stock ticker sometimes it works (sort of) and other time it's way off. I was thinking to have a separate script for the morning (your original) and then a modified script for the afternoon. Here's the code:what you are asking for is an ORB study
https://usethinkscript.com/search/1840985/?q=orb&o=date
here is one i made
change the time to 15min
it draws an arrow when a line is crossed
Code:#orbs_05_cln #http://tos.mx/qJhPhgr # halcyonguy # 2021-09 # ORB, opening range levels def na = Double.NaN; input timeframe = { t1min , t2min , t3min , t5min , t10min , t15min , default t30min }; input show_ORB_label = yes; input show_range_lines = no; def srl = show_range_lines; input orb_range_lines_pricepercent = 16; # % of the diff of upper line - lower line def olpp = orb_range_lines_pricepercent; input show_arrows = yes; def period = AggregationPeriod.day; # open/close times (ET) input start = 0930; input end = 1600; def daytime = if secondsfromTime(start) >= 0 and secondstillTime(end) > 0 then 1 else 0; def agg; def per; switch (timeframe) { # add t1min , t2min , t3min , t4min , case t1min: agg = AggregationPeriod.MIN; per = 1; case t2min: agg = AggregationPeriod.two_MIN; per = 2; case t3min: agg = AggregationPeriod.three_MIN; per = 3; #case t4min: # agg = AggregationPeriod.FOUR_MIN; # per = 4; case t5min: agg = AggregationPeriod.fIVE_MIN; per = 5; case t10min: agg = AggregationPeriod.Ten_MIN; per = 10; case t15min: agg = AggregationPeriod.FIFTEEN_MIN; per = 15; #case t20min: # agg = AggregationPeriod.FIFTEEN_MIN; # per = 20; case t30min: agg = AggregationPeriod.THIRTY_MIN; per = 30; #case t60min: # agg = AggregationPeriod.hOUR; # per = 60; #default: # agg = aggregationPeriod.FIFTEEN_MIN; } addlabel(show_ORB_label, per + " ORB" , color.cyan); # get candle width , seconds , timeframe #def getaggmin = round(getaggregationPeriod()/60,0); def getgg = getaggregationPeriod(); def getaggmin = round(getgg/60,0); # test if agg time is > than chart time def aggok = if (getaggmin*60) <= agg then 1 else 0; def durationsec = per * 60; def secondspassed = secondsfromTime(start); # simulated firstbar , based on orb time def firstbar = if secondspassed >= 0 and secondspassed < durationsec then 1 else 0; #addchartbubble(yes,low,per + "__" + firstbar + "__" + agg); def afterfirst = if ( daytime and !firstbar ) then 1 else 0; # is this the first bar after open ? def openbar = if secondspassed >= 0 and secondspassed <= getgg then 1 else 0; def ehi = high(period = agg); def elo = low(period = agg); # looks at firstbar , which is orbtime , NOT bar[1] def perhigh = if !daytime then na else if firstbar then ehi else perhigh[1]; def perlow = if !daytime then na else if firstbar then elo else perlow[1]; # ..................................................... # calc % tolerance levels within orb lines # def olpp = orblines_pricepercent; def linediff = perhigh - perlow; def orbperamt = linediff * (olpp/100); def orbupperper = perhigh - orbperamt; def orblowerper = perlow + orbperamt; def upperrng = if ( close < perhigh and close > orbupperper) then 1 else 0; def lowerrng = if ( close > perlow and close < orblowerper) then 1 else 0; addlabel(upperrng,"upper range", color.green); addlabel(lowerrng,"lower range", color.red); # def srl = show_range_lines; # draw lines at x% within orb lines # plot dots for first bar timeframe plot hiperdots = if (srl and daytime) then orbupperper else na; plot loperdots = if (srl and daytime) then orblowerper else na; hiperdots.setpaintingStrategy(paintingStrategy.points); loperdots.setpaintingStrategy(paintingStrategy.pointS); hiperdots.setDefaultColor(color.violet); loperdots.setDefaultColor(color.violet); hiperdots.hidebubble(); loperdots.hidebubble(); # ..................................................... # add label if beyond orb range addlabel((close > perhigh),"above upper line", color.green); addlabel((close < perlow),"below lower line", color.red); # ..................................................... # plot dots for first bar timeframe plot hidots = if firstbar then perhigh else na; plot lodots = if firstbar then perlow else na; hidots.setpaintingStrategy(paintingStrategy.points); lodots.setpaintingStrategy(paintingStrategy.pointS); hidots.setDefaultColor(color.yellow); lodots.setDefaultColor(color.yellow); # plot line after first bar plot hiline = if !firstbar then perhigh else na; plot loline = if !firstbar then perlow else na; hiline.setpaintingStrategy(paintingStrategy.line); loline.setpaintingStrategy(paintingStrategy.line); hiline.setDefaultColor(color.yellow); loline.setDefaultColor(color.yellow); def afterabove = if (show_arrows and (close crosses above perhigh)) then 1 else 0; def afterbelow = if (show_arrows and (close crosses below perlow)) then 1 else 0; # plot arrows on crossover points def vfac5 = .0014; plot upline = if afterabove then min( low , (hiline * (1 - vfac5))) else na; plot dwnline = if afterbelow then max(high, (loline * (1 + vfac5))) else na; upline.setPaintingStrategy(paintingStrategy.ARROW_UP); dwnline.setPaintingStrategy(paintingStrategy.ARROW_down); upline.setDefaultColor(color.cyan); dwnline.setDefaultColor(color.cyan); upline.setlineWeight(4); dwnline.setlineWeight(4); upline.hideBubble(); dwnline.hideBubble(); #
#orbs_05_cln
#http://tos.mx/qJhPhgr
#Found at: https://usethinkscript.com/threads/...ns-after-stock-market-opens.20525/post-151022
# halcyonguy
# 2021-09
# ORB, opening range levels
def na = Double.NaN;
input timeframe = { t1min , t2min , t3min , t5min , t10min , t15min ,t60min, default t30min };
input show_ORB_label = yes;
input show_range_lines = no;
def srl = show_range_lines;
input orb_range_lines_pricepercent = 16;
# % of the diff of upper line - lower line
def olpp = orb_range_lines_pricepercent;
input show_arrows = yes;
def period = AggregationPeriod.day;
# open/close times (ET)
input start = 1230;
input end = 1600;
def daytime = if secondsfromTime(start) >= 0 and secondstillTime(end) > 0 then 1 else 0;
def agg;
def per;
switch (timeframe) {
# add t1min , t2min , t3min , t4min ,
case t1min:
agg = AggregationPeriod.MIN;
per = 1;
case t2min:
agg = AggregationPeriod.two_MIN;
per = 2;
case t3min:
agg = AggregationPeriod.three_MIN;
per = 3;
#case t4min:
# agg = AggregationPeriod.FOUR_MIN;
# per = 4;
case t5min:
agg = AggregationPeriod.fIVE_MIN;
per = 5;
case t10min:
agg = AggregationPeriod.Ten_MIN;
per = 10;
case t15min:
agg = AggregationPeriod.FIFTEEN_MIN;
per = 15;
#case t20min:
# agg = AggregationPeriod.FIFTEEN_MIN;
# per = 20;
case t30min:
agg = AggregationPeriod.THIRTY_MIN;
per = 30;
case t60min:
agg = AggregationPeriod.hour;
per = 60;
#default:
#agg = aggregationPeriod.FIFTEEN_MIN;
}
addlabel(show_ORB_label, per + " ORB" , color.cyan);
# get candle width , seconds , timeframe
#def getaggmin = round(getaggregationPeriod()/60,0);
def getgg = getaggregationPeriod();
def getaggmin = round(getgg/60,0);
# test if agg time is > than chart time
def aggok = if (getaggmin*60) <= agg then 1 else 0;
def durationsec = per * 60;
def secondspassed = secondsfromTime(start);
# simulated firstbar , based on orb time
def firstbar = if secondspassed >= 0 and secondspassed < durationsec then 1 else 0;
#addchartbubble(yes,low,per + "" + firstbar + "" + agg);
def afterfirst = if ( daytime and !firstbar ) then 1 else 0;
# is this the first bar after open ?
def openbar = if secondspassed >= 0 and secondspassed <= getgg then 1 else 0;
def ehi = high(period = agg);
def elo = low(period = agg);
# looks at firstbar , which is orbtime , NOT bar[1]
def perhigh = if !daytime then na else if firstbar then ehi else perhigh[1];
def perlow = if !daytime then na else if firstbar then elo else perlow[1];
# .....................................................
# calc % tolerance levels within orb lines
# def olpp = orblines_pricepercent;
def linediff = perhigh - perlow;
def orbperamt = linediff * (olpp/100);
def orbupperper = perhigh - orbperamt;
def orblowerper = perlow + orbperamt;
def upperrng = if ( close < perhigh and close > orbupperper) then 1 else 0;
def lowerrng = if ( close > perlow and close < orblowerper) then 1 else 0;
#addlabel(upperrng,"upper range", color.green);
#addlabel(lowerrng,"lower range", color.red);
# def srl = show_range_lines;
# draw lines at x% within orb lines
# plot dots for first bar timeframe
plot hiperdots = if (srl and daytime) then orbupperper else na;
plot loperdots = if (srl and daytime) then orblowerper else na;
hiperdots.setpaintingStrategy(paintingStrategy.points);
loperdots.setpaintingStrategy(paintingStrategy.pointS);
hiperdots.setDefaultColor(color.violet);
loperdots.setDefaultColor(color.violet);
hiperdots.hidebubble();
loperdots.hidebubble();
# .....................................................
# add label if beyond orb range
#addlabel((close > perhigh),"above upper line", color.green);
#addlabel((close < perlow),"below lower line", color.red);
# .....................................................
# plot dots for first bar timeframe
plot hidots = if firstbar then perhigh else na;
plot lodots = if firstbar then perlow else na;
hidots.setpaintingStrategy(paintingStrategy.points);
lodots.setpaintingStrategy(paintingStrategy.pointS);
hidots.setDefaultColor(color.yellow);
lodots.setDefaultColor(color.yellow);
# plot line after first bar
plot hiline = if !firstbar then perhigh else na;
plot loline = if !firstbar then perlow else na;
hiline.setpaintingStrategy(paintingStrategy.line);
loline.setpaintingStrategy(paintingStrategy.line);
hiline.setDefaultColor(color.yellow);
loline.setDefaultColor(color.yellow);
def afterabove = if (show_arrows and (close crosses above perhigh)) then 1 else 0;
def afterbelow = if (show_arrows and (close crosses below perlow)) then 1 else 0;
# plot arrows on crossover points
def vfac5 = .0014;
plot upline = if afterabove then min( low , (hiline * (1 - vfac5))) else na;
plot dwnline = if afterbelow then max(high, (loline * (1 + vfac5))) else na;
upline.setPaintingStrategy(paintingStrategy.ARROW_UP);
dwnline.setPaintingStrategy(paintingStrategy.ARROW_down);
upline.setDefaultColor(color.cyan);
dwnline.setDefaultColor(color.cyan);
upline.setlineWeight(4);
dwnline.setlineWeight(4);
upline.hideBubble();
dwnline.hideBubble();
# END
#---------Added Chart Label that shows the difference between H+L
def diff = hiline - loline;
#AddLabel(1, "HLgap " + AsDollars(diff),
#if diff > 0.31 then Color.Green else if diff < 0.30 and diff > 0.20
# then Color.Yellow else color.light_gray);
AddLabel(1, "H>" + AsDollars(diff) + "<L",
if diff > 0.31 then Color.Green else if diff < 0.30 and diff > 0.20
then Color.Yellow else color.light_gray);
IHopeToLearn
New member
Hi, I love this. Of course I started to customize it for me and I added a chart label that measured the gap between the High and the Low, sort of a ATR. Then (and this is where I really need your opinion on this) to have a second ORB at the 12:30 - 1:30 time, however it just doesn't seem to work, I'm sure it's me. I'm thinking much like a Anchored Vwap. We need to adjust our game for the afternoon. Does this make sense and if it does could you help with this code because for some reason the dots don't line up with the plotted lines and I noticed if I change the stock ticker sometimes it works (sort of) and other time it's way off. I was thinking to have a separate script for the morning (your original) and then a modified script for the afternoon. Here's the code:
#orbs_05_cln
#http://tos.mx/qJhPhgr
#Found at: https://usethinkscript.com/threads/...ns-after-stock-market-opens.20525/post-151022
# halcyonguy
# 2021-09
# ORB, opening range levels
def na = Double.NaN;
input timeframe = { t1min , t2min , t3min , t5min , t10min , t15min ,t60min, default t30min };
input show_ORB_label = yes;
input show_range_lines = no;
def srl = show_range_lines;
input orb_range_lines_pricepercent = 16;
# % of the diff of upper line - lower line
def olpp = orb_range_lines_pricepercent;
input show_arrows = yes;
def period = AggregationPeriod.day;
# open/close times (ET)
input start = 1230;
input end = 1600;
def daytime = if secondsfromTime(start) >= 0 and secondstillTime(end) > 0 then 1 else 0;
def agg;
def per;
switch (timeframe) {
# add t1min , t2min , t3min , t4min ,
case t1min:
agg = AggregationPeriod.MIN;
per = 1;
case t2min:
agg = AggregationPeriod.two_MIN;
per = 2;
case t3min:
agg = AggregationPeriod.three_MIN;
per = 3;
#case t4min:
# agg = AggregationPeriod.FOUR_MIN;
# per = 4;
case t5min:
agg = AggregationPeriod.fIVE_MIN;
per = 5;
case t10min:
agg = AggregationPeriod.Ten_MIN;
per = 10;
case t15min:
agg = AggregationPeriod.FIFTEEN_MIN;
per = 15;
#case t20min:
# agg = AggregationPeriod.FIFTEEN_MIN;
# per = 20;
case t30min:
agg = AggregationPeriod.THIRTY_MIN;
per = 30;
case t60min:
agg = AggregationPeriod.hour;
per = 60;
#default:
#agg = aggregationPeriod.FIFTEEN_MIN;
}
addlabel(show_ORB_label, per + " ORB" , color.cyan);
# get candle width , seconds , timeframe
#def getaggmin = round(getaggregationPeriod()/60,0);
def getgg = getaggregationPeriod();
def getaggmin = round(getgg/60,0);
# test if agg time is > than chart time
def aggok = if (getaggmin*60) <= agg then 1 else 0;
def durationsec = per * 60;
def secondspassed = secondsfromTime(start);
# simulated firstbar , based on orb time
def firstbar = if secondspassed >= 0 and secondspassed < durationsec then 1 else 0;
#addchartbubble(yes,low,per + "" + firstbar + "" + agg);
def afterfirst = if ( daytime and !firstbar ) then 1 else 0;
# is this the first bar after open ?
def openbar = if secondspassed >= 0 and secondspassed <= getgg then 1 else 0;
def ehi = high(period = agg);
def elo = low(period = agg);
# looks at firstbar , which is orbtime , NOT bar[1]
def perhigh = if !daytime then na else if firstbar then ehi else perhigh[1];
def perlow = if !daytime then na else if firstbar then elo else perlow[1];
# .....................................................
# calc % tolerance levels within orb lines
# def olpp = orblines_pricepercent;
def linediff = perhigh - perlow;
def orbperamt = linediff * (olpp/100);
def orbupperper = perhigh - orbperamt;
def orblowerper = perlow + orbperamt;
def upperrng = if ( close < perhigh and close > orbupperper) then 1 else 0;
def lowerrng = if ( close > perlow and close < orblowerper) then 1 else 0;
#addlabel(upperrng,"upper range", color.green);
#addlabel(lowerrng,"lower range", color.red);
# def srl = show_range_lines;
# draw lines at x% within orb lines
# plot dots for first bar timeframe
plot hiperdots = if (srl and daytime) then orbupperper else na;
plot loperdots = if (srl and daytime) then orblowerper else na;
hiperdots.setpaintingStrategy(paintingStrategy.points);
loperdots.setpaintingStrategy(paintingStrategy.pointS);
hiperdots.setDefaultColor(color.violet);
loperdots.setDefaultColor(color.violet);
hiperdots.hidebubble();
loperdots.hidebubble();
# .....................................................
# add label if beyond orb range
#addlabel((close > perhigh),"above upper line", color.green);
#addlabel((close < perlow),"below lower line", color.red);
# .....................................................
# plot dots for first bar timeframe
plot hidots = if firstbar then perhigh else na;
plot lodots = if firstbar then perlow else na;
hidots.setpaintingStrategy(paintingStrategy.points);
lodots.setpaintingStrategy(paintingStrategy.pointS);
hidots.setDefaultColor(color.yellow);
lodots.setDefaultColor(color.yellow);
# plot line after first bar
plot hiline = if !firstbar then perhigh else na;
plot loline = if !firstbar then perlow else na;
hiline.setpaintingStrategy(paintingStrategy.line);
loline.setpaintingStrategy(paintingStrategy.line);
hiline.setDefaultColor(color.yellow);
loline.setDefaultColor(color.yellow);
def afterabove = if (show_arrows and (close crosses above perhigh)) then 1 else 0;
def afterbelow = if (show_arrows and (close crosses below perlow)) then 1 else 0;
# plot arrows on crossover points
def vfac5 = .0014;
plot upline = if afterabove then min( low , (hiline * (1 - vfac5))) else na;
plot dwnline = if afterbelow then max(high, (loline * (1 + vfac5))) else na;
upline.setPaintingStrategy(paintingStrategy.ARROW_UP);
dwnline.setPaintingStrategy(paintingStrategy.ARROW_down);
upline.setDefaultColor(color.cyan);
dwnline.setDefaultColor(color.cyan);
upline.setlineWeight(4);
dwnline.setlineWeight(4);
upline.hideBubble();
dwnline.hideBubble();
# END
#---------Added Chart Label that shows the difference between H+L
def diff = hiline - loline;
#AddLabel(1, "HLgap " + AsDollars(diff),
#if diff > 0.31 then Color.Green else if diff < 0.30 and diff > 0.20
# then Color.Yellow else color.light_gray);
AddLabel(1, "H>" + AsDollars(diff) + "<L",
if diff > 0.31 then Color.Green else if diff < 0.30 and diff > 0.20
then Color.Yellow else color.light_gray);
Halcyonguy, I had found your ORB study after and have been using it. I find it much simpler to understand and less clutter. One thing I was working on is a PM ORB study, I have two charts one AM and the other PM where I just changed the time and color of the lines for identification. But I don't know if as valuable yet. So thanks for a concise Thinkscript!what you are asking for is an ORB study
https://usethinkscript.com/search/1840985/?q=orb&o=date
here is one i made
change the time to 15min
it draws an arrow when a line is crossed
Code:#orbs_05_cln #http://tos.mx/qJhPhgr # halcyonguy # 2021-09 # ORB, opening range levels def na = Double.NaN; input timeframe = { t1min , t2min , t3min , t5min , t10min , t15min , default t30min }; input show_ORB_label = yes; input show_range_lines = no; def srl = show_range_lines; input orb_range_lines_pricepercent = 16; # % of the diff of upper line - lower line def olpp = orb_range_lines_pricepercent; input show_arrows = yes; def period = AggregationPeriod.day; # open/close times (ET) input start = 0930; input end = 1600; def daytime = if secondsfromTime(start) >= 0 and secondstillTime(end) > 0 then 1 else 0; def agg; def per; switch (timeframe) { # add t1min , t2min , t3min , t4min , case t1min: agg = AggregationPeriod.MIN; per = 1; case t2min: agg = AggregationPeriod.two_MIN; per = 2; case t3min: agg = AggregationPeriod.three_MIN; per = 3; #case t4min: # agg = AggregationPeriod.FOUR_MIN; # per = 4; case t5min: agg = AggregationPeriod.fIVE_MIN; per = 5; case t10min: agg = AggregationPeriod.Ten_MIN; per = 10; case t15min: agg = AggregationPeriod.FIFTEEN_MIN; per = 15; #case t20min: # agg = AggregationPeriod.FIFTEEN_MIN; # per = 20; case t30min: agg = AggregationPeriod.THIRTY_MIN; per = 30; #case t60min: # agg = AggregationPeriod.hOUR; # per = 60; #default: # agg = aggregationPeriod.FIFTEEN_MIN; } addlabel(show_ORB_label, per + " ORB" , color.cyan); # get candle width , seconds , timeframe #def getaggmin = round(getaggregationPeriod()/60,0); def getgg = getaggregationPeriod(); def getaggmin = round(getgg/60,0); # test if agg time is > than chart time def aggok = if (getaggmin*60) <= agg then 1 else 0; def durationsec = per * 60; def secondspassed = secondsfromTime(start); # simulated firstbar , based on orb time def firstbar = if secondspassed >= 0 and secondspassed < durationsec then 1 else 0; #addchartbubble(yes,low,per + "__" + firstbar + "__" + agg); def afterfirst = if ( daytime and !firstbar ) then 1 else 0; # is this the first bar after open ? def openbar = if secondspassed >= 0 and secondspassed <= getgg then 1 else 0; def ehi = high(period = agg); def elo = low(period = agg); # looks at firstbar , which is orbtime , NOT bar[1] def perhigh = if !daytime then na else if firstbar then ehi else perhigh[1]; def perlow = if !daytime then na else if firstbar then elo else perlow[1]; # ..................................................... # calc % tolerance levels within orb lines # def olpp = orblines_pricepercent; def linediff = perhigh - perlow; def orbperamt = linediff * (olpp/100); def orbupperper = perhigh - orbperamt; def orblowerper = perlow + orbperamt; def upperrng = if ( close < perhigh and close > orbupperper) then 1 else 0; def lowerrng = if ( close > perlow and close < orblowerper) then 1 else 0; addlabel(upperrng,"upper range", color.green); addlabel(lowerrng,"lower range", color.red); # def srl = show_range_lines; # draw lines at x% within orb lines # plot dots for first bar timeframe plot hiperdots = if (srl and daytime) then orbupperper else na; plot loperdots = if (srl and daytime) then orblowerper else na; hiperdots.setpaintingStrategy(paintingStrategy.points); loperdots.setpaintingStrategy(paintingStrategy.pointS); hiperdots.setDefaultColor(color.violet); loperdots.setDefaultColor(color.violet); hiperdots.hidebubble(); loperdots.hidebubble(); # ..................................................... # add label if beyond orb range addlabel((close > perhigh),"above upper line", color.green); addlabel((close < perlow),"below lower line", color.red); # ..................................................... # plot dots for first bar timeframe plot hidots = if firstbar then perhigh else na; plot lodots = if firstbar then perlow else na; hidots.setpaintingStrategy(paintingStrategy.points); lodots.setpaintingStrategy(paintingStrategy.pointS); hidots.setDefaultColor(color.yellow); lodots.setDefaultColor(color.yellow); # plot line after first bar plot hiline = if !firstbar then perhigh else na; plot loline = if !firstbar then perlow else na; hiline.setpaintingStrategy(paintingStrategy.line); loline.setpaintingStrategy(paintingStrategy.line); hiline.setDefaultColor(color.yellow); loline.setDefaultColor(color.yellow); def afterabove = if (show_arrows and (close crosses above perhigh)) then 1 else 0; def afterbelow = if (show_arrows and (close crosses below perlow)) then 1 else 0; # plot arrows on crossover points def vfac5 = .0014; plot upline = if afterabove then min( low , (hiline * (1 - vfac5))) else na; plot dwnline = if afterbelow then max(high, (loline * (1 + vfac5))) else na; upline.setPaintingStrategy(paintingStrategy.ARROW_UP); dwnline.setPaintingStrategy(paintingStrategy.ARROW_down); upline.setDefaultColor(color.cyan); dwnline.setDefaultColor(color.cyan); upline.setlineWeight(4); dwnline.setlineWeight(4); upline.hideBubble(); dwnline.hideBubble(); #
i feel bad for sharing that old code. here is something shorter and better,
https://usethinkscript.com/threads/shaded-opening-range-no-breakout.17922/#post-137959
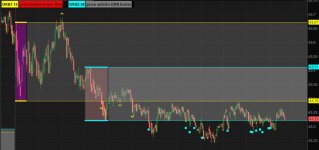
double ORB
in your study, there are many duplicate variables. they need to be renamed
here is a double orb, from my other , simpler study
i copied it twice as a new study. then renamed all the variables, by adding a 1 or a 2
#orb_double_01

#orb_colors_04
#https://usethinkscript.com/threads/shaded-opening-range-no-breakout.17922/
#Shaded Opening Range (No Breakout)


# 2020-01
# halcyonguy
def na = Double.NaN;


def chartagg = GetAggregationPeriod();
def chartmin = Round(chartagg / 60, 0);


# pick an agg time
input orb1_time = AggregationPeriod.FIFTEEN_MIN;
def orb1_min = orb1_time / 60000;

input show_ORB1_label = yes;
input show_arrows1 = yes;

# open/close times  (ET)
input start1 = 0930;
input end1 = 1600;
def daytime1 = if SecondsFromTime(start1) >= 0 and SecondsTillTime(end1) > 0 then 1 else 0;
def daytime_first1 = SecondsFromTime(start1) == 0;


# test if agg time is > than chart time
def aggok = if chartmin <= orb1_min then 1 else 0;


def durationsec1 = orb1_min * 60;
def secondspassed1 = SecondsFromTime(start1);
#  simulated firstbar , based on orb time
def firstbar1 = if secondspassed1 >= 0 and secondspassed1 < durationsec1 then 1 else 0;
#addchartbubble(yes,low,per + "__" + firstbar + "__" + agg);
def afterfirst1 = if ( daytime1 and !firstbar1 ) then 1 else 0;

# is this the first bar after open ?
def openbar1 = if secondspassed1 >= 0 and secondspassed1 <= chartagg then 1 else 0;

def ehi1 = high(period = orb1_time);
def elo1 = low(period = orb1_time);

#  looks at firstbar ,  which is orbtime ,  NOT bar[1]
def perhigh1 = if !daytime1 then na else if firstbar1 then ehi1 else perhigh1[1];
def perlow1 = if !daytime1 then na else if firstbar1 then elo1 else perlow1[1];

# .....................................................

AddLabel(1, " ", Color.BLACK);
AddLabel(show_ORB1_label, "ORB1 " + orb1_min, Color.yellow);
#AddLabel(1, " ", Color.BLACK);
AddLabel((close > perhigh1), "price above upper line", Color.GREEN);
AddLabel((close < perlow1), "price below lower line", Color.RED);
AddLabel((close <= perhigh1 and close >= perlow1), "price within ORB limits", Color.gray);
AddLabel(1, " ", Color.BLACK);

# .....................................................

# plot dots for first bar timeframe
plot hidots1 = if firstbar1 then perhigh1 else na;
plot lodots1 = if firstbar1 then perlow1 else na;
hidots1.SetPaintingStrategy(PaintingStrategy.POINTS);
lodots1.SetPaintingStrategy(PaintingStrategy.POINTS);
hidots1.SetDefaultColor(Color.YELLOW);
lodots1.SetDefaultColor(Color.YELLOW);


# plot line after first bar
plot hiline1 = if !firstbar1 then perhigh1 else na;
plot loline1 = if !firstbar1 then perlow1 else na;
hiline1.SetPaintingStrategy(PaintingStrategy.LINE);
loline1.SetPaintingStrategy(PaintingStrategy.LINE);
hiline1.SetDefaultColor(Color.YELLOW);
loline1.SetDefaultColor(Color.YELLOW);

#DefineGlobalColor("orb",color.magenta);
#DefineGlobalColor("orb_after",color.gray);
DefineGlobalColor("orb", Color.MAGENTA);
DefineGlobalColor("orb_after", Color.GRAY);

input show_orb1_cloud = yes;
def dottop1 = if show_orb1_cloud then hidots1 else na;
def linetop1 = if show_orb1_cloud then hiline1 else na;

AddCloud(dottop1, lodots1, GlobalColor("orb"));
AddCloud(linetop1, loline1, GlobalColor("orb_after"));

# input show_arrows = yes;
#def afterabove = if (show_arrows and ((!afterfirst[1] and afterfirst and close > hiline) or (close crosses above hiline))) then 1 else 0;
def afterabove1 = if !show_arrows1 then 0
 else if (IsNaN(hiline1[1]) and !IsNaN(hiline1) and close > hiline1) then 1
 else if (close crosses above hiline1) then 1
 else 0;

def afterbelow1 = if !show_arrows1 then 0
 else if (IsNaN(loline1[1]) and !IsNaN(loline1) and close < loline1) then 1
 else if (close crosses below loline1) then 1
 else 0;


# plot arrows on crossover points
def vfac5 = .0014;
#plot upline = if afterabove then (hiline * (1 - vfac5)) else na;
plot upline1 = if afterabove1 then 1 else 0;
#upline.setPaintingStrategy(paintingStrategy.ARROW_UP);
upline1.SetPaintingStrategy(PaintingStrategy.BOOLEAN_WEDGE_UP);
upline1.SetDefaultColor(Color.yellow);
upline1.SetLineWeight(3);
upline1.HideBubble();


#plot dwnline = if afterbelow then (loline * (1 + vfac5)) else na;
plot dwnline1 = if afterbelow1 then 1 else 0;
#dwnline.setPaintingStrategy(paintingStrategy.ARROW_down);
dwnline1.SetPaintingStrategy(PaintingStrategy.BOOLEAN_WEDGE_DOWN);
dwnline1.SetDefaultColor(Color.yellow);
dwnline1.SetLineWeight(3);
dwnline1.HideBubble();


AddChartBubble(0, low,
(IsNaN(loline1[1]) and !IsNaN(loline1) and close < loline1)
, Color.YELLOW, no);
#
#
#

#----------------------------

# orb 2


# pick an agg time
input orb2_time = AggregationPeriod.FIFTEEN_MIN;
def orb2_min = orb2_time / 60000;

input show_ORB2_label = yes;
input show_arrows2 = yes;

# open/close times  (ET)
input start2 = 1100;
input end2 = 1600;
def daytime2 = if SecondsFromTime(start2) >= 0 and SecondsTillTime(end2) > 0 then 1 else 0;
def daytime_first2 = SecondsFromTime(start2) == 0;

# test if agg time is > than chart time
def aggok2 = if chartmin <= orb2_min then 1 else 0;


def durationsec2 = orb2_min * 60;
def secondspassed2 = SecondsFromTime(start2);
#  simulated firstbar , based on orb time
def firstbar2 = if secondspassed2 >= 0 and secondspassed2 < durationsec2 then 1 else 0;
#addchartbubble(yes,low,per + "__" + firstbar + "__" + agg);
def afterfirst2 = if ( daytime2 and !firstbar2 ) then 1 else 0;

# is this the first bar after open ?
def openbar2 = if secondspassed2 >= 0 and secondspassed2 <= chartagg then 1 else 0;

def ehi2 = high(period = orb2_time);
def elo2 = low(period = orb2_time);

#  looks at firstbar ,  which is orbtime ,  NOT bar[1]
def perhigh2 = if !daytime2 then na else if firstbar2 then ehi2 else perhigh2[1];
def perlow2 = if !daytime2 then na else if firstbar2 then elo2 else perlow2[1];

# .....................................................

AddLabel(1, " ", Color.BLACK);
AddLabel(show_ORB2_label, "ORB2 " + orb2_min, Color.cyan);
#AddLabel(1, " ", Color.BLACK);
AddLabel((close > perhigh2), "price above upper line", Color.GREEN);
AddLabel((close < perlow2), "price below lower line", Color.RED);
AddLabel((close <= perhigh2 and close >= perlow2), "price within ORB limits", Color.gray);
AddLabel(1, " ", Color.BLACK);

# .....................................................

# plot dots for first bar timeframe
plot hidots2 = if firstbar2 then perhigh2 else na;
plot lodots2 = if firstbar2 then perlow2 else na;
hidots2.SetPaintingStrategy(PaintingStrategy.POINTS);
lodots2.SetPaintingStrategy(PaintingStrategy.POINTS);
hidots2.SetDefaultColor(Color.cyan);
lodots2.SetDefaultColor(Color.cyan);


# plot line after first bar
plot hiline2 = if !firstbar2 then perhigh2 else na;
plot loline2 = if !firstbar2 then perlow2 else na;
hiline2.SetPaintingStrategy(PaintingStrategy.LINE);
loline2.SetPaintingStrategy(PaintingStrategy.LINE);
hiline2.SetDefaultColor(Color.cyan);
loline2.SetDefaultColor(Color.cyan);

DefineGlobalColor("orb2",color.pink);
DefineGlobalColor("orb2_after",color.light_gray);
#DefineGlobalColor("orb", Color.MAGENTA);
#DefineGlobalColor("orb_after", Color.GRAY);

input show_orb2_cloud = yes;
def dottop2 = if show_orb2_cloud then hidots2 else na;
def linetop2 = if show_orb2_cloud then hiline2 else na;

AddCloud(dottop2, lodots2, GlobalColor("orb2"));
AddCloud(linetop2, loline2, GlobalColor("orb2_after"));

# input show_arrows = yes;
#def afterabove = if (show_arrows and ((!afterfirst[1] and afterfirst and close > hiline) or (close crosses above hiline))) then 1 else 0;
def afterabove2 = if !show_arrows2 then 0
 else if (IsNaN(hiline2[1]) and !IsNaN(hiline2) and close > hiline2) then 1
 else if (close crosses above hiline2) then 1
 else 0;

def afterbelow2 = if !show_arrows2 then 0
 else if (IsNaN(loline2[1]) and !IsNaN(loline2) and close < loline2) then 1
 else if (close crosses below loline2) then 1
 else 0;


# plot arrows on crossover points
def v2 = .0005;
#plot upline2 = if afterabove2 then (hiline2 * (1 + v2)) else na;
plot upline2 = if afterabove2 then (high * (1 + v2)) else na;
#plot upline2 = if afterabove2 then 1 else 0;
#upline.setPaintingStrategy(paintingStrategy.ARROW_UP);
#upline2.SetPaintingStrategy(PaintingStrategy.BOOLEAN_WEDGE_UP);
upline2.SetPaintingStrategy(PaintingStrategy.squares);
upline2.SetDefaultColor(Color.cyan);
upline2.SetLineWeight(4);
upline2.HideBubble();

#plot dwnline2 = if afterbelow2 then (loline2 * (1 - v2)) else na;
plot dwnline2 = if afterbelow2 then (low * (1 - v2)) else na;
#plot dwnline2 = if afterbelow2 then high else 0;
#dwnline.setPaintingStrategy(paintingStrategy.ARROW_down);
#dwnline2.SetPaintingStrategy(PaintingStrategy.BOOLEAN_WEDGE_DOWN);
dwnline2.SetPaintingStrategy(PaintingStrategy.squares);
dwnline2.SetDefaultColor(Color.cyan);
dwnline2.SetLineWeight(4);
dwnline2.HideBubble();


AddChartBubble(0, low,
(IsNaN(loline2[1]) and !IsNaN(loline2) and close < loline2)
, Color.YELLOW, no);

#
Attachments
Join useThinkScript to post your question to a community of 21,000+ developers and traders.
| Thread starter | Similar threads | Forum | Replies | Date |
|---|---|---|---|---|
| T | Draw a lines between two points | Questions | 2 | |
| M | Draw high low wick high and low of a particular candle | Questions | 2 | |
| S | draw a high and low line based on 3-4PM price action | Questions | 1 | |
|
|
Wanted: Draw the high/low of the ORB on various futures markets | Questions | 2 | |
| R | Draw Vertical Line for Awesome Oscillator | Questions | 5 |
Similar threads
-
-
-
-
 Wanted: Draw the high/low of the ORB on various futures markets
- Started by FreefallJM03
- Replies: 2
-
Not the exact question you're looking for?
Start a new thread and receive assistance from our community.
Similar threads
-
-
-
-
Wanted: Draw the high/low of the ORB on various futures markets
- Started by FreefallJM03
- Replies: 2
-
Similar threads
-
-
-
-
Wanted: Draw the high/low of the ORB on various futures markets
- Started by FreefallJM03
- Replies: 2
-
The Market Trading Game Changer
- Exclusive indicators
- Proven strategies & setups
- Private Discord community
- ‘Buy The Dip’ signal alerts
- Exclusive members-only content
- Add-ons and resources
- 1 full year of unlimited support
Frequently Asked Questions
useThinkScript is the #1 community of stock market investors using indicators and other tools to power their trading strategies. Traders of all skill levels use our forums to learn about scripting and indicators, help each other, and discover new ways to gain an edge in the markets.
We get it. Our forum can be intimidating, if not overwhelming. With thousands of topics, tens of thousands of posts, our community has created an incredibly deep knowledge base for stock traders. No one can ever exhaust every resource provided on our site.
If you are new, or just looking for guidance, here are some helpful links to get you started.
- The most viewed thread:
https://usethinkscript.com/threads/repainting-trend-reversal-for-thinkorswim.183/ - Our most popular indicator:
https://usethinkscript.com/threads/buy-the-dip-indicator-for-thinkorswim.3553/ - Answers to frequently asked questions:
https://usethinkscript.com/threads/answers-to-commonly-asked-questions.6006/