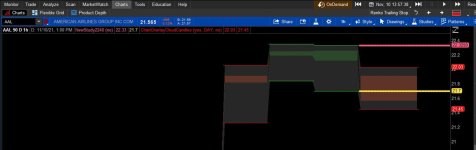
I've been working on this for days and can't figure it out. The script plots lines at the prior day's high and low so that during RTH, I can see if intraday price is near the prior high/low. On another version of this study, I also have the week and month as well but I kept the code small for this post. Simple enough.
Assume today is Tuesday. What I want to do is once Tuesday's trading day is over (but is still the same day), I want to shift the plotted lines from Monday's close to today's closed bar (Tuesday). Then at Wednesday's open. the plotted lines should shift back to Tuesday's hi/lo.
I tried to create dynamic offsets but TOS doesn't like that. I tried to modify the code to add a variable to shift the plots forward after RTH but TOS doesn't like that. I've tried several other ways and can't figure out how to get it to work. Any advise would be awesome! @halcyonguy
Code:
# prevday_levels_onalldays_01
# halcyonguy
# 21-08-12
#
# find high, low, opens
# draw a horizontal line across the chart, at the price levels.
# can change the offset , to look at older periods.
# bubbles on the right, identify the lines.
#  the bubbles list the offset.

# Modifications by Tim G
#Sept 14, 2021
#Sept 26, 2021
#Nov 8, 2021


input showbubbles = yes;
input show1d  = yes;
input offset = 1;

# place bubbles after last bar, to id the lines

def futurebar = 3;
def x = (!IsNaN(close[futurebar]) and IsNaN(close[futurebar - 1]));


### 1d timeframe ###

def tf1d = AggregationPeriod.DAY;
def valid1d = GetAggregationPeriod() <= AggregationPeriod.DAY;
def h1d;
def l1d;
def l1dago;
def o1d;
def o1dc;
def c1d;


if valid1d and show1d {
    h1d = high (period = tf1d)[offset]; ;
    l1d = low  (period = tf1d) [offset];
    l1dago = low  (period = tf1d)[1];
    o1d = open (period = tf1d);
    o1dc =  open (period = tf1d);
    c1d = close(period = tf1d);


} else {
    h1d = Double.NaN;
    l1d = Double.NaN;
    l1dago = Double.NaN;
    o1d = Double.NaN;
    o1dc = Double.NaN;
    c1d = Double.NaN;
}


def bn1d = HighestAll(if open == o1dc then BarNumber()-1 else Double.NaN);

plot daylow = if BarNumber() < bn1d then Double.NaN else HighestAll( if (!IsNaN(close) and IsNaN(close[-1])) then l1d else double.nan);
plot daylow2 = if BarNumber() < bn1d then Double.NaN else HighestAll( if (!IsNaN(close) and IsNaN(close[-1]))then l1d else double.nan);
plot dayhigh = if BarNumber() < bn1d then Double.NaN else HighestAll( if (!IsNaN(close) and IsNaN(close[-1]))then h1d else double.nan);

plot dayhigh2 = if BarNumber() < bn1d then Double.NaN else HighestAll( if (!IsNaN(close) and IsNaN(close[-1]))then h1d else double.nan);

dayhigh.SetDefaultColor(Color.YELLOW);
dayhigh.SetStyle(Curve.SHORT_DASH);
dayhigh.SetLineWeight(1);
dayhigh2.SetDefaultColor(Color.CYAN);
dayhigh2.SetLineWeight(1);

daylow.SetDefaultColor(Color.YELLOW);
daylow.SetStyle(Curve.SHORT_DASH);
daylow.SetLineWeight(1);
daylow2.SetDefaultColor(Color.CYAN);
daylow2.SetLineWeight(1);

AddChartBubble(showbubbles and x, daylow, "D[" + offset + "]", Color.MAGENTA, yes);
AddChartBubble(showbubbles and x, dayhigh, "D[" + offset + "]", Color.GREEN, yes);") Hopefully my mods won't mess up the code but I think it should be fine. I'll see tomorrow and let you know. Thank you again! And thank you
Hopefully my mods won't mess up the code but I think it should be fine. I'll see tomorrow and let you know. Thank you again! And thank you