
IsItPossible
Member
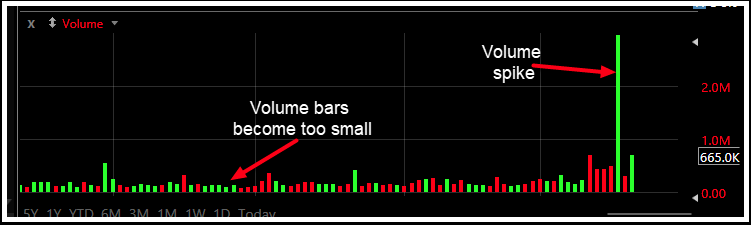
When an unusual amount of volume happens on any given time frame, the resulting volume bar will tend to skew the rest of the volume bars in view. In order to accommodate the large volume bar for the volume spike, the other volume bars become unusually small. This makes volume trends difficult to see.
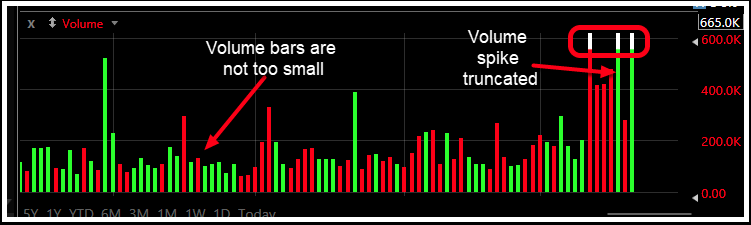
Can we truncate (adjust) those spike volume bars to maintain a more balanced volume view.
Something like this:
Here is the working script so far:
#----------------------------------------------------------------------------
# Author: IsItPossible
#
# Name: My_Volume_Truncate_Spikes
# Summary: This study can be used as an indicator which helps us suppress
# when an unusual amount of volume happens on any given time frame, the resulting
# volume bar will tend to skew the rest of the volume bars in view. In order to
# accommodate the large volume bar for the volume spike, the other volume bars become
# unusually small. This makes volume trends difficult to see.
#
# This indicator truncates (adjust) those volume spike bars to maintain a more
# balanced volume view.
#
#----------------------------------------------------------------------------
declare lower;
# Define input parameters
input thresholdMultiplier = 2.0; #Hint thresholdMultiplier: Specify the threshold multiplier for identifying volume spikes
input avgLength = 50; #Hint avgLength: Specify the bars to be considered to calculate average volume
input ColorAsPrice = {default false, true};
# Calculate the average volume over a specified period
def averageVolume = Average(volume, avgLength);
# Calculate the threshold volume level
def thresholdVolume = averageVolume * thresholdMultiplier;
# Identify volume spikes
def isVolumeSpike = volume > thresholdVolume;
# Plotting volume spikes
def maxPeriod = if GetAggregationPeriod() == AggregationPeriod.DAY then 252 else if GetAggregationPeriod() < AggregationPeriod.WEEK then 50 else if GetAggregationPeriod() < AggregationPeriod.MONTH then 12 else 10;
plot VolumeSpike = isVolumeSpike and Highest(thresholdVolume, maxPeriod) < volume;
VolumeSpike.SetPaintingStrategy(PaintingStrategy.BOOLEAN_ARROW_UP);
VolumeSpike.SetDefaultColor(Color.LIGHT_ORANGE);
# Truncating volume spikes
def truncatedVolume = if isVolumeSpike and Highest(thresholdVolume,maxPeriod ) < volume then Highest(thresholdVolume, maxPeriod) else volume;
# Plotting truncated volume
plot TruncatedVolumep = truncatedVolume;
#TruncatedVolumep.SetPaintingStrategy(PaintingStrategy.HISTOGRAM);
TruncatedVolumep.SetDefaultColor(Color.CURRENT);
TruncatedVolumep.SetPaintingStrategy(PaintingStrategy.HISTOGRAM);
#TruncatedVolumep.SetLineWeight(3);
TruncatedVolumep.DefineColor("Up", Color.UPTICK);
TruncatedVolumep.DefineColor("Down", Color.DOWNTICK);
TruncatedVolumep.DefineColor("Current", Color.CYAN);
TruncatedVolumep.AssignValueColor(if ColorAsPrice then (if close > close[1] then TruncatedVolumep.Color("Up") else if close < close[1] then TruncatedVolumep.Color("Down") else GetColor(1)) else TruncatedVolumep.Color("Current") );
Last edited:
")