bluedreamver
New member
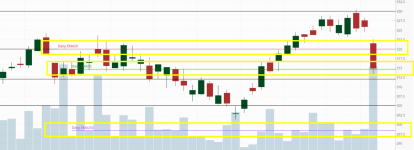
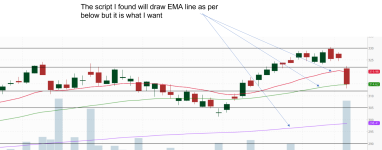
I found script below only plot the EMA line but would like to top up the auto populate horizontal line with closing point to EMA close price, any idea how to amend the script to add on this kind of line?
input price = FundamentalType.CLOSE;
input aggregationPeriod = AggregationPeriod.DAY;
input length = 20;
input averageType = AverageType. EXPONENTIAL;
plot MovAvg = MovingAverage(averageType, Fundamental(price, period = aggregationPeriod), length);
input price = FundamentalType.CLOSE;
input aggregationPeriod = AggregationPeriod.DAY;
input length = 20;
input averageType = AverageType. EXPONENTIAL;
plot MovAvg = MovingAverage(averageType, Fundamental(price, period = aggregationPeriod), length);