Horizontal Line @ Specific Time

RlyNotUrBroker

New member
Hello. I'm sure this is a basic question but I'm just getting into ThinkScript but I can't figure out for the life of me how to get a horizontal line to plot at the previous day close. what I have is as follows:

def lasttrade = close;
plot test = close;
def aggregation = aggregationPeriod.DAY;

it will plot a line at every close price for the chart timeframe I'm looking at, but I want it to plot only a horizontal line at the previous day close.
Basically I want it to look at only the previous candle and plot a horizontal line across the chart that marks the previous close
I've tried the painting strategy.HORIZONTAL but it gives me a syntax error and I don't know where to go with this anymore. any help is appreciated!
 
Last edited by a moderator:
@SleepyZ

I tried to use this code by updating the time with my needs but I could not figure out the extension for the 1:30 , I am looking the 1:30 candle to get extended to the next, if u could help me on that.

again Thank you so much


The code from https://usethinkscript.com/threads/horizontal-line-specific-time.7327/post-114857 that I think you used has the 'High' as the price to plot.
Based upon your request above, I modified that code to plot 2 lines from the times to the next day's same times.
Screenshot 2024-10-13 171908.jpg
Code:
#Horizontal_Lines_at_SelectTimes_to_next_day

input price = open;

input time1 = 0000;
input time2 = 1330;

input show_lines  = yes;
input show_labels = yes;

def na      = Double.NaN;

def sec1 = SecondsFromTime(time1);
def sec2 = SecondsFromTime(time2);
def isTime1 = (sec1 >= 0 and sec1[1] < 0) or (sec1 < sec1[1] and sec1 >= 0);
def isTime2 = (sec2 >= 0 and sec2[1] < 0) or (sec2 < sec2[1] and sec2 >= 0);

def ln1     = if istime1 then price else ln1[1];
def ln2     = if istime2 then price else ln2[1];

plot line1  = if !show_lines then na else ln1;
plot line2  = if !show_lines then na else ln2;

line1.SetPaintingStrategy(PaintingStrategy.DASHES);
line2.SetPaintingStrategy(PaintingStrategy.DASHES);

addlabel(show_labels, "Time1: " + asprice(time1), line1.takeValueColor());
addlabel(show_labels, "Time2: " + asprice(time2), line2.takeValueColor());

#
 

Join useThinkScript to post your question to a community of 21,000+ developers and traders.

The code from https://usethinkscript.com/threads/horizontal-line-specific-time.7327/post-114857 that I think you used has the 'High' as the price to plot.
Based upon your request above, I modified that code to plot 2 lines from the times to the next day's same times.

HI @SleepyZ Thanks for writing this script. This is what i am searching for. I selected two time frame (mid night open and market open).

1. After adding the script and when I move the charts left or right the lines are NOT locked to the candles and they look like floating. Can you please help to fix them?

2. Can you please add an option to show today lines only?

3. Can the lines stop at 4 PM EST (Line 1: mid night to 4 PM. Line 2: 9.30 AM to 4 PM)?

4. Can you please add bubble with price at open on the line?

Thanks for your support .


1757101916200.png
 
Last edited:
HI @SleepyZ Thanks for writing this script. This is what i am searching for. I selected two time frame (mid night open and market open).

1. After adding the script and when I move the charts left or right the lines are NOT locked to the candles and they look like floating. Can you please help to fix them?

2. Can you please add an option to show today lines only?

3. Can the lines stop at 4 PM EST (Line 1: mid night to 4 PM. Line 2: 9.30 AM to 4 PM)?

4. Can you please add bubble with price at open on the line?

Thanks for your support .


View attachment 25661

This should help do all that you want. Use the inputs to control what you want.
The image is shown using EST zone and midnight (0000) and 0930 starts ending at 1600
The lines are limited to the number input at number_lines_to_show and end at 1600.
Code:
#Horizontal_Lines_at_SelectTimes_to_endtime

input price = open;

input time1 = 0000;
input time2 = 0930;
input endtime = 1600;

input number_lines_to_show = 1;
input show_lines  = yes;
input show_labels = yes;

def na      = Double.NaN;

def sec1 = SecondsFromTime(time1);
def sec2 = SecondsFromTime(time2);
def isTime1 = (sec1 >= 0 and sec1[1] < 0) or (sec1 < sec1[1] and sec1 >= 0);
def isTime2 = (sec2 >= 0 and sec2[1] < 0) or (sec2 < sec2[1] and sec2 >= 0);

def ln1     = if isTime1 then price else if SecondsFromTime(endtime) > 0 then na else ln1[1];
def ln2     = if isTime2 then price else if SecondsFromTime(endtime) > 0 then na else ln2[1];

def ln1count = if isTime1 then ln1count[1] + 1 else ln1count[1];
def ln1cond  = HighestAll(ln1count) - ln1count + 1;
def ln2count = if isTime2 then ln2count[1] + 1 else ln2count[1];
def ln2cond  = HighestAll(ln2count) - ln2count + 1;
#addchartBubble(1,low,ln1count+"\n"+ln1cond,color.yellow,no);

plot line1  = if !show_lines or ln1cond > number_lines_to_show then na else ln1;
plot line2  = if !show_lines or ln2cond > number_lines_to_show then na else ln2;

line1.SetPaintingStrategy(PaintingStrategy.DASHES);
line2.SetPaintingStrategy(PaintingStrategy.DASHES);

AddLabel(show_labels, "Time1: " + AsPrice(time1), line1.TakeValueColor());
AddLabel(show_labels, "Time2: " + AsPrice(time2), line2.TakeValueColor());

input show_bubbles = yes;
AddChartBubble(show_bubbles and isTime1 and ln1cond <= number_lines_to_show, price, price, line1.TakeValueColor());
AddChartBubble(show_bubbles and isTime2 and ln2cond <= number_lines_to_show, price, price, line2.TakeValueColor());

#
 
This should help do all that you want. Use the inputs to control what you want.
The image is shown using EST zone and midnight (0000) and 0930 starts ending at 1600
The lines are limited to the number input at number_lines_to_show and end at 1600.
Thank you @SleepyZ . Great.

One minor adjustment. Is it possible to move the bubble on right?
 
Thank you @SleepyZ . Great.

One minor adjustment. Is it possible to move the bubble on right?

The bubbles are movable and displayed now on the right
Code:
#Horizontal_Lines_at_SelectTimes_to_endtime

input price = open;

input time1 = 0000;
input time2 = 0930;
input endtime = 1600;

input number_lines_to_show = 1;
input show_lines  = yes;
input show_labels = yes;

def na      = Double.NaN;

def sec1 = SecondsFromTime(time1);
def sec2 = SecondsFromTime(time2);
def isTime1 = (sec1 >= 0 and sec1[1] < 0) or (sec1 < sec1[1] and sec1 >= 0);
def isTime2 = (sec2 >= 0 and sec2[1] < 0) or (sec2 < sec2[1] and sec2 >= 0);

def ln1     = if isTime1 then price else if SecondsFromTime(endtime) > 0 then na else ln1[1];
def ln2     = if isTime2 then price else if SecondsFromTime(endtime) > 0 then na else ln2[1];

def ln1count = if isTime1 then ln1count[1] + 1 else ln1count[1];
def ln1cond  = HighestAll(ln1count) - ln1count + 1;
def ln2count = if isTime2 then ln2count[1] + 1 else ln2count[1];
def ln2cond  = HighestAll(ln2count) - ln2count + 1;
#addchartBubble(1,low,ln1count+"\n"+ln1cond,color.yellow,no);

plot line1  = if !show_lines or ln1cond > number_lines_to_show then na else ln1;
plot line2  = if !show_lines or ln2cond > number_lines_to_show then na else ln2;

line1.SetPaintingStrategy(PaintingStrategy.DASHES);
line2.SetPaintingStrategy(PaintingStrategy.DASHES);

AddLabel(show_labels, "Time1: " + AsPrice(time1), line1.TakeValueColor());
AddLabel(show_labels, "Time2: " + AsPrice(time2), line2.TakeValueColor());

input show_bubbles = yes;
input bubblemover  = 3;
def mover = !IsNaN(close[bubblemover + 1]) and IsNaN(close[bubblemover]);
AddChartBubble(show_bubbles and mover and ln1cond[bubblemover + 1] <= number_lines_to_show, line1[bubblemover + 1], ln1[bubblemover + 1], line1.TakeValueColor());
AddChartBubble(show_bubbles and mover and ln2cond[bubblemover + 1] <= number_lines_to_show, line2[bubblemover + 1], ln2[bubblemover + 1], line2.TakeValueColor());

#
 
I want to code an indicator in ThinkScript for use on TOS charts. I want to get the close of (whatever the bar name is) at 5PM. It seems the candles on TOS are called by the open and use an aggregate time to set the close. The problem is using an open to determine a close means the indicator will not work from one time frame to the next. I had a stock indicator and it was always frustrating because the indicator started at 0:45 bar. I have tried to change it but it does not fall on the close of any candle. In fact some days the indicator is far away from what should be the bar that closed. It is very confusing to me, when I look at any other platform, the time shown is the closing time for the candle that is open. Here is the code:
Code:
# Inputs
input targetTime = 1700; # Target time in HHMM format (5:00 PM ET)
input showOnlyLastPeriod = no;

# Determines if the current candle is the exact bar that closes at 17:00 ET
def is1700Close = SecondsTillTime(targetTime) == 0;

# Holds the close price of the 1700 candle as soon as it completes
def level1700 = if is1700Close then close else level1700[1];

# Projects the previous day's 1700 close forward until the next 1700 candle closes
def prior1700Close = if is1700Close then level1700[1] else prior1700Close[1];

# Plotting
plot Line1700Close;

if showOnlyLastPeriod and !IsNaN(close[-1]) {
    Line1700Close = Double.NaN;
} else {
    Line1700Close = prior1700Close;
}

Line1700Close.SetDefaultColor(GetColor(9));
Line1700Close.SetPaintingStrategy(PaintingStrategy.HORIZONTAL);

I have also attached a chart which shows the result.
BV7nI1d.png
 
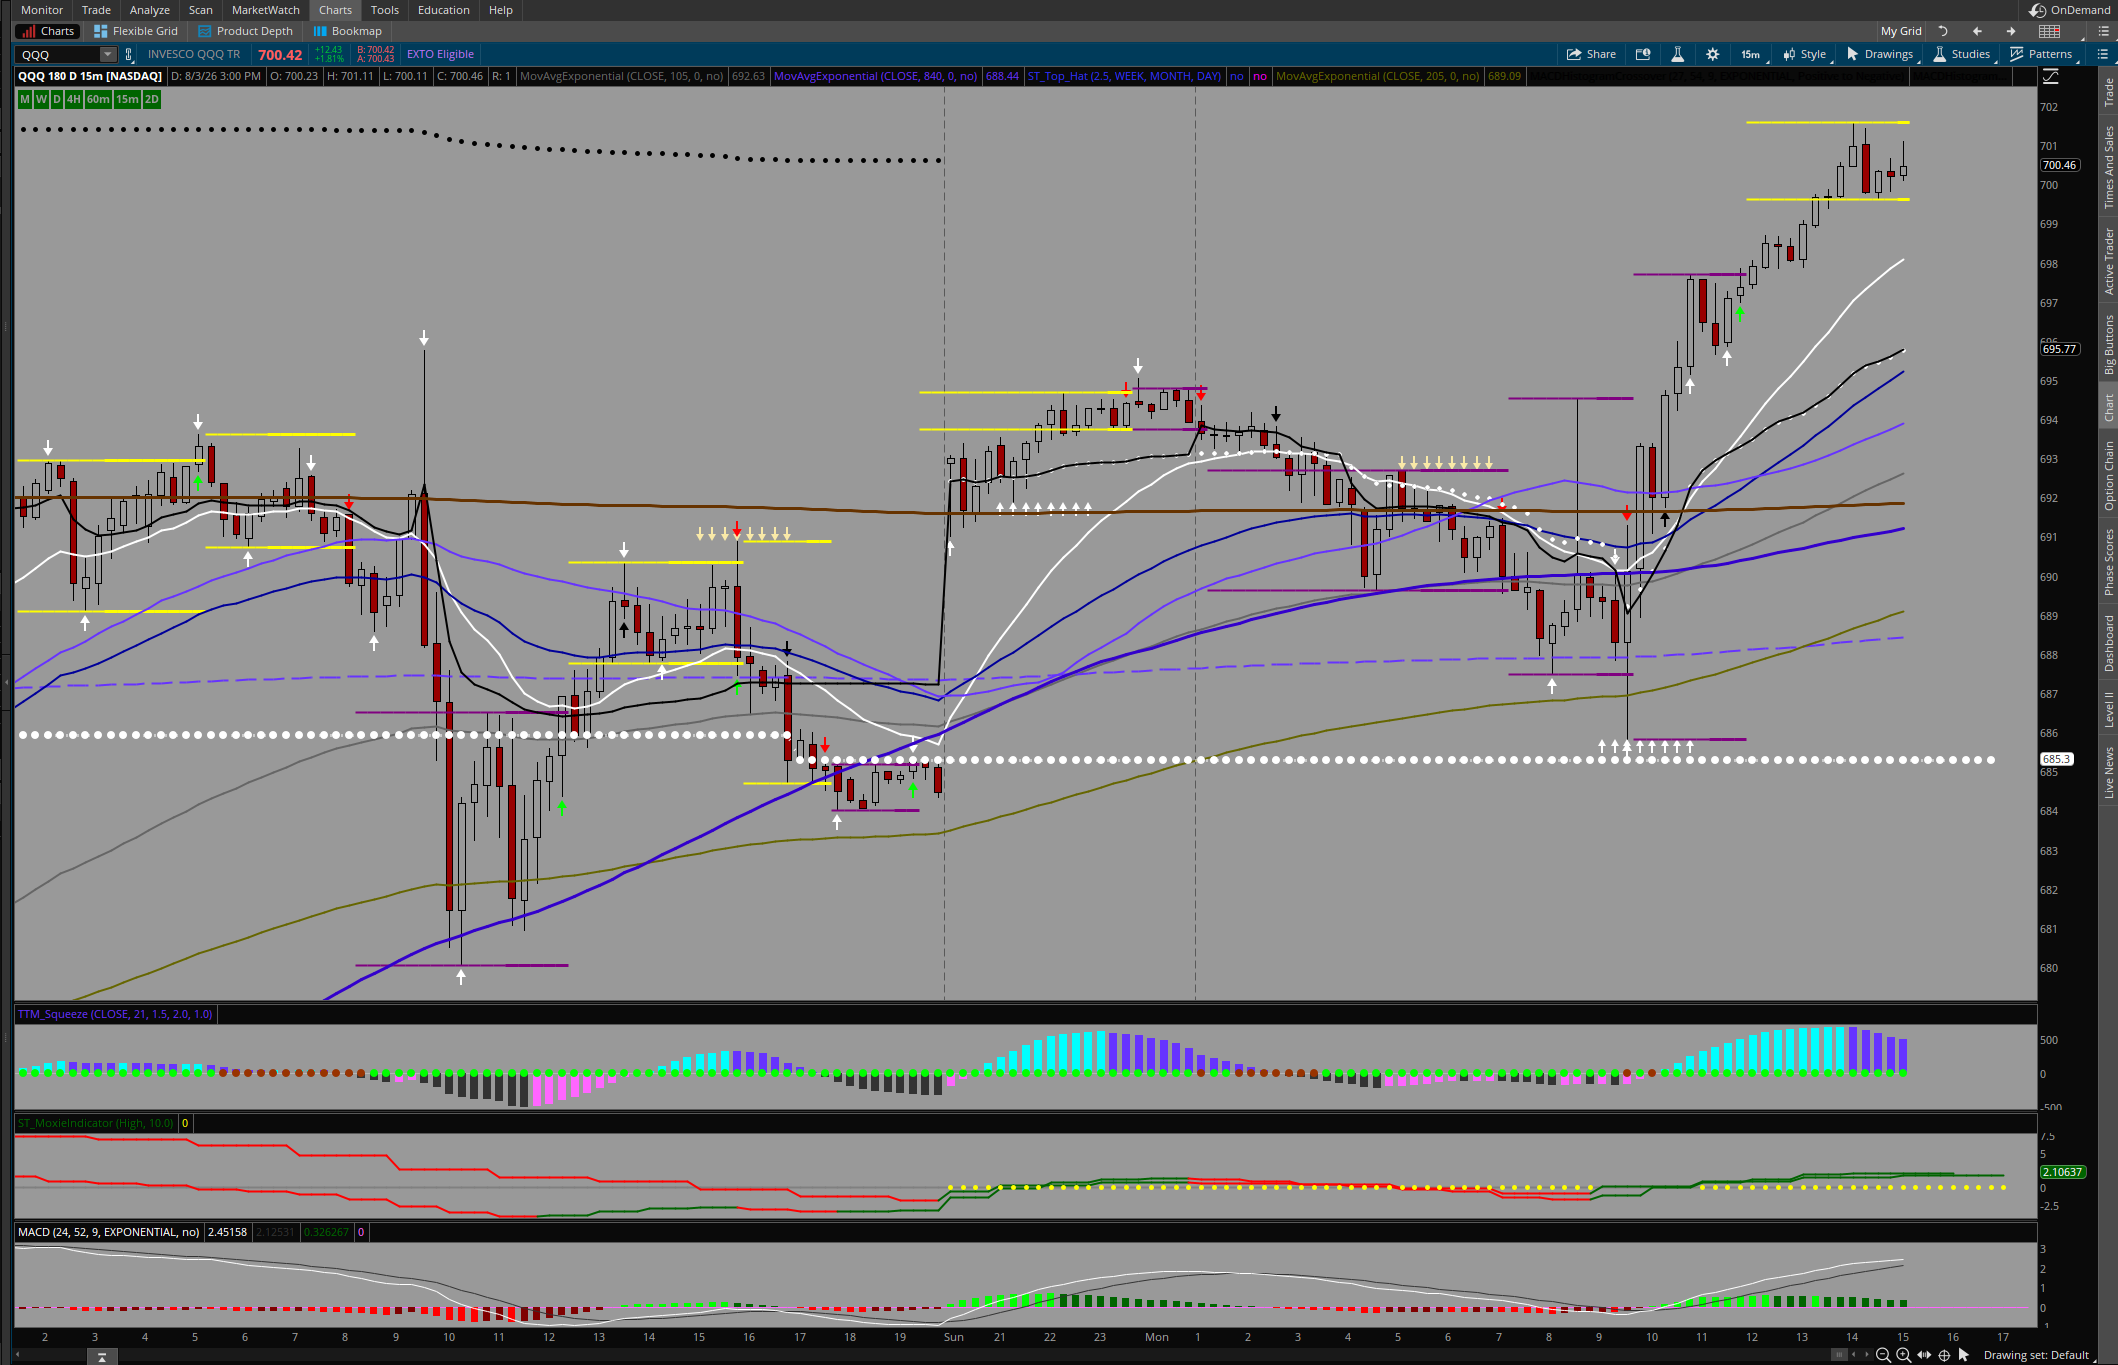
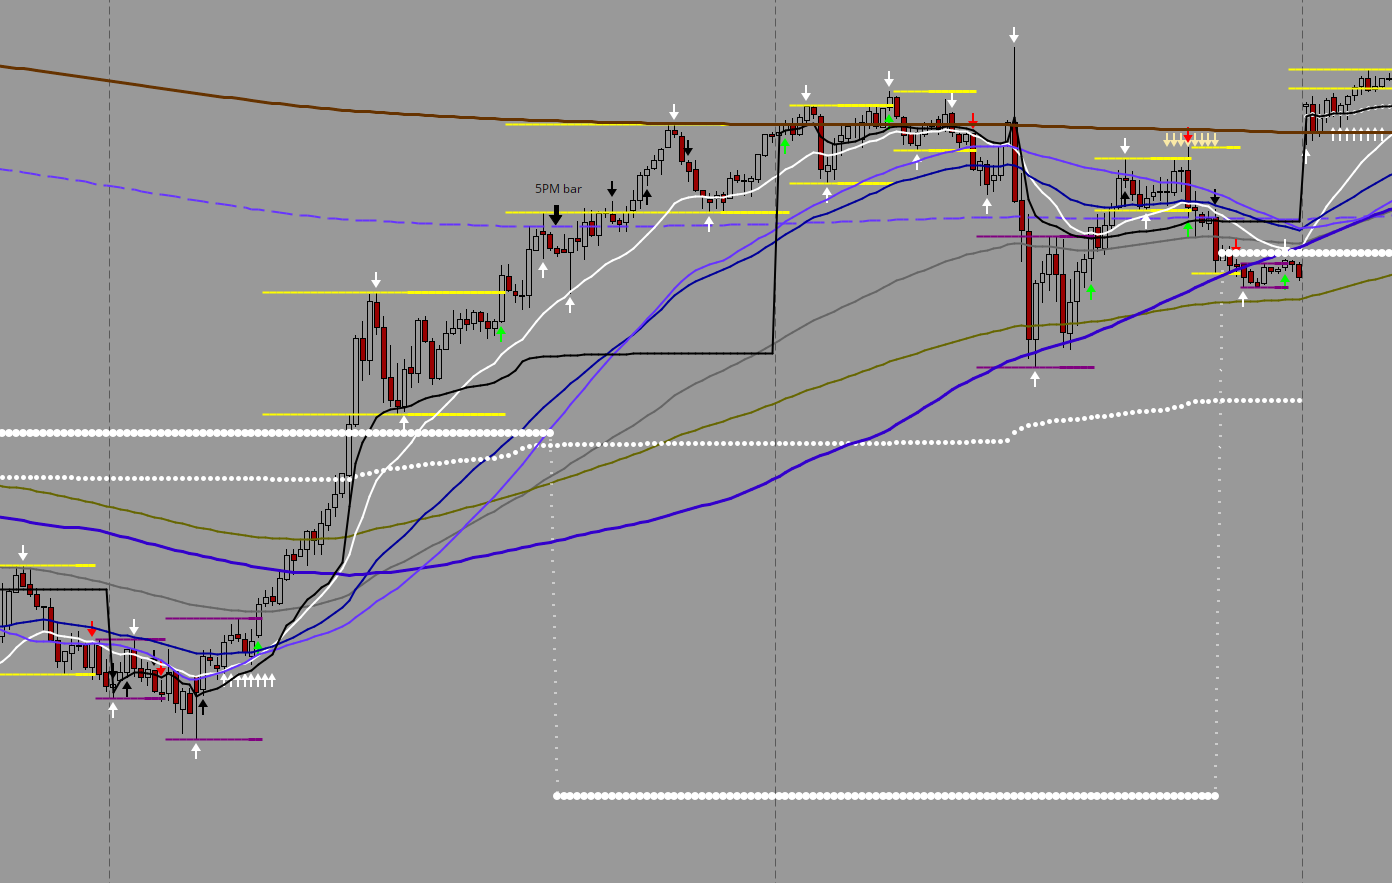
Thanks. I have been working on this all day. I finally have what I want and I am going to use it for the next few before I get into the next phase. It plots as I want it on the 1, 5, 15, 30 and 60M charts, all the same value on all the charts. The problem with TOS is the use of the open instead of the close to define a candle. I have been working and so far looks good. Here is a screenshot. It marks the prior day close at the 5PM candle. May have to change it for instruments that don't trade in ETH.

RLdGQQM.png
 
Hello. I'm sure this is a basic question but I'm just getting into ThinkScript but I can't figure out for the life of me how to get a horizontal line to plot at the previous day close. what I have is as follows:

def lasttrade = close;
plot test = close;
def aggregation = aggregationPeriod.DAY;

it will plot a line at every close price for the chart timeframe I'm looking at, but I want it to plot only a horizontal line at the previous day close.
Basically I want it to look at only the previous candle and plot a horizontal line across the chart that marks the previous close
I've tried the painting strategy.HORIZONTAL but it gives me a syntax error and I don't know where to go with this anymore. any help is appreciated!
Feel free to try this. Just worked it out today and I am trying it out.

Code:
# Inputs
input targetTime = 1700; # 5:00 PM ET Target
input showOnlyLastPeriod = no;

# 1. Trigger right when the 17:00 bar begins
def is1700 = SecondsFromTime(targetTime) == 0;

# 2. Lock the exact price tick at that instant
def exact1700Level = if is1700 then close[1] else exact1700Level[1];

# Plotting
plot Data;

if showOnlyLastPeriod and !IsNaN(close[-1]) {
Data = Double.NaN;
} else {
Data = exact1700Level;
}

Data.SetDefaultColor(GetColor(9));
Data.SetPaintingStrategy(PaintingStrategy.HORIZONTAL);

Here is a screen shot. Gets the close at 5PM, close enough for me anyway.

Screenshot 2026-08-03 151319.png
 
Last edited by a moderator:

Similar threads

Not the exact question you're looking for?

Start a new thread and receive assistance from our community.

87k+ Posts
797 Online
Create Post

Similar threads

Similar threads

The Market Trading Game Changer

Join 2,500+ subscribers inside the useThinkScript VIP Membership Club
  • Exclusive indicators
  • Proven strategies & setups
  • Private Discord community
  • ‘Buy The Dip’ signal alerts
  • Exclusive members-only content
  • Add-ons and resources
  • 1 full year of unlimited support

Frequently Asked Questions

What is useThinkScript?

useThinkScript is the #1 community of stock market investors using indicators and other tools to power their trading strategies. Traders of all skill levels use our forums to learn about scripting and indicators, help each other, and discover new ways to gain an edge in the markets.

How do I get started?

We get it. Our forum can be intimidating, if not overwhelming. With thousands of topics, tens of thousands of posts, our community has created an incredibly deep knowledge base for stock traders. No one can ever exhaust every resource provided on our site.

If you are new, or just looking for guidance, here are some helpful links to get you started.

What are the benefits of VIP Membership?
VIP members get exclusive access to these proven and tested premium indicators: Buy the Dip, Advanced Market Moves 2.0, Take Profit, and Volatility Trading Range. In addition, VIP members get access to over 50 VIP-only custom indicators, add-ons, and strategies, private VIP-only forums, private Discord channel to discuss trades and strategies in real-time, customer support, trade alerts, and much more. Learn all about VIP membership here.
How can I access the premium indicators?
To access the premium indicators, which are plug and play ready, sign up for VIP membership here.
Back
Top