Hello All. New member here and beginner thinkscript user.
Script for identifying highest daily volume over custom date range
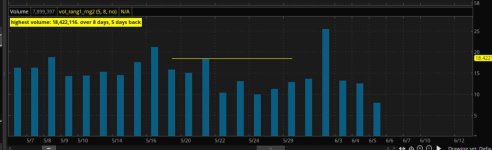
I would like to create a basic scan that looks at the most recent "X" days volume (excluding current day) and comparing it to the daily high volume over the previous "Y" days/bars (excluding current day and most recent "X" number of days. Ultimate use is to create a scan based on price range, minimum volume, perhaps market cap and then meeting the criteria where the most recent X days daily volume are greater than the previous Y days highest day.
I've been able to use the basic Volume[] script to get previous days volume. See below.
def D1 = volume[1] ;
def D2 = volume[2] ;
def D3 = volume[3] ;
Then I suppose I need a way to find the previous daily high. In a somewhat human readable format: PreviousHigh = HighestDailyVolume between D4 through D180. I know this nowhere near actual thinkscript.
Once I have the PreviousHigh, let's call it PH, then I would like to add conditions where D1>PH and D2>PH and D3>PH.
All the scripts I've found that identify the PH use a length that include the current day...or the previous day at best. Below is the closest one I could find and somewhat (actually not really) understand. Hoping there is an easier way. Appreciate any insight more experienced users may have.
def IsDaily = GetAggregationPeriod() == AggregationPeriod.DAY ;
#def IsWeekly = GetAggregationPeriod() == AggregationPeriod.WEEK;
#def Ismonthly = GetAggregationPeriod() == AggregationPeriod.MONTH ;
def length = 4 ;
#else if IsWeekly then 52 else if Ismonthly then 12 else Double.NaN;
def LastBar = HighestAll(if IsNaN(close[-1]) and !IsNaN(close) then BarNumber() else Double.NaN);
def BarCD = LastBar - BarNumber() <= length;
def HighVol = HighestAll(if BarCD then volume else Double.NaN);
#def highvol = HighestAll(volume);
plot VolLine = if BarCD then HighVol else Double.NaN;
plot top = if volume == HighVol then volume else Double.NaN;
top.SetPaintingStrategy(PaintingStrategy.TRIANGLES);
top.SetDefaultColor(Color.WHITE);
top.SetLineWeight(5);
Script for identifying highest daily volume over custom date range
I would like to create a basic scan that looks at the most recent "X" days volume (excluding current day) and comparing it to the daily high volume over the previous "Y" days/bars (excluding current day and most recent "X" number of days. Ultimate use is to create a scan based on price range, minimum volume, perhaps market cap and then meeting the criteria where the most recent X days daily volume are greater than the previous Y days highest day.
I've been able to use the basic Volume[] script to get previous days volume. See below.
def D1 = volume[1] ;
def D2 = volume[2] ;
def D3 = volume[3] ;
Then I suppose I need a way to find the previous daily high. In a somewhat human readable format: PreviousHigh = HighestDailyVolume between D4 through D180. I know this nowhere near actual thinkscript.
Once I have the PreviousHigh, let's call it PH, then I would like to add conditions where D1>PH and D2>PH and D3>PH.
All the scripts I've found that identify the PH use a length that include the current day...or the previous day at best. Below is the closest one I could find and somewhat (actually not really) understand. Hoping there is an easier way. Appreciate any insight more experienced users may have.
def IsDaily = GetAggregationPeriod() == AggregationPeriod.DAY ;
#def IsWeekly = GetAggregationPeriod() == AggregationPeriod.WEEK;
#def Ismonthly = GetAggregationPeriod() == AggregationPeriod.MONTH ;
def length = 4 ;
#else if IsWeekly then 52 else if Ismonthly then 12 else Double.NaN;
def LastBar = HighestAll(if IsNaN(close[-1]) and !IsNaN(close) then BarNumber() else Double.NaN);
def BarCD = LastBar - BarNumber() <= length;
def HighVol = HighestAll(if BarCD then volume else Double.NaN);
#def highvol = HighestAll(volume);
plot VolLine = if BarCD then HighVol else Double.NaN;
plot top = if volume == HighVol then volume else Double.NaN;
top.SetPaintingStrategy(PaintingStrategy.TRIANGLES);
top.SetDefaultColor(Color.WHITE);
top.SetLineWeight(5);
Last edited by a moderator: