OGOptionSlayer
Well-known member
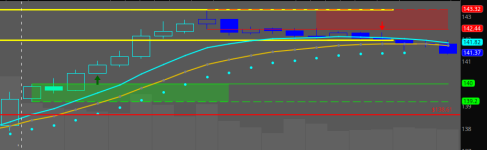
I didn't answer your delta of .7. The reason why you do this is that you aren't getting eaten up by premiums and there is more actual intrinsic value in the contract. I would rather take less positions and have way less premium decay than have 40 contracts that get melted away as they get closer to expiry.How do I change the colors of the bars signaling to buy a call/put?
and @OGOptionSlayer , are you primarily trading SPX options with a delta of 0.7?
Most successful traders do not trade OTM option contracts. There simply isn't enough value in them as you are paying way too much for premiums and ultimately this affects your P/L in the short and long term. Go with .7's and see the difference.
One thing you will notice delta 70's also is that your palms don't sweat as much, you don't get as frustrated, and you can focus on your actual strategy and setups much more clearly.