I'm looking for horizontal lines for the high/low between today and X days ago. I was able to get the high/low from X days ago, but how should I modify this to include highs and lows from the period between X and today? In this example I'm looking back 3 days. I have the high/low from the 3rd day.

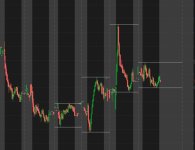
Ideally I want it to look something like this

Ruby:
def daysback = 3;
plot near_high = HighestAll(if IsNaN(high[-1]) and !IsNaN(high)
then high(period = AggregationPeriod.DAY)[daysback]
else Double.NaN);
near_high.SetDefaultColor(color.GREEN);


plot near_low = LowestAll(if IsNaN(low[-1]) and !IsNaN(low)
then low(period = AggregationPeriod.DAY)[daysback]
else Double.NaN);
near_low.SetDefaultColor(color.RED);
Ideally I want it to look something like this