
High and Low Reversals Indicator + Intraday Strategy For ThinkOrSwim
- Thread starter BenTen
- Start date
-
- Tags
- trading strategy trend


Ben's Swing Trading Strategy + Indicator
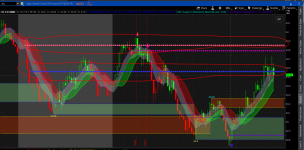
I wouldn't call this a course. My goal is zero fluff. I will jump right into my current watchlist, tell you the ThinkorSwim indicator that I'm using, and past trade setups to help you understand my swing trading strategy.
Similar threads
-
 Repaints The PAM v5 High Low Chart Setup For ThinkOrSwim
- Started by OGOptionSlayer
- Replies: 46
-
Repaints The PAM High Low Chart Setup For ThinkOrSwim
- Started by OGOptionSlayer
- Replies: 461
-
 RTH High Low (Murrey Math / Donchian ) Strategy
- Started by RickK
- Replies: 11
-
Percent From High Dynamic Channel + Breakout System For ThinkOrSwim
- Started by uplink
- Replies: 3
-
Repaints AGAIG High Profit Options Trading Chart For ThinkOrSwim
- Started by csricksdds
- Replies: 37
Similar threads
-
Repaints The PAM v5 High Low Chart Setup For ThinkOrSwim
- Started by OGOptionSlayer
- Replies: 46
-
Repaints The PAM High Low Chart Setup For ThinkOrSwim
- Started by OGOptionSlayer
- Replies: 461
-
RTH High Low (Murrey Math / Donchian ) Strategy
- Started by RickK
- Replies: 11
-
Percent From High Dynamic Channel + Breakout System For ThinkOrSwim
- Started by uplink
- Replies: 3
-
Repaints AGAIG High Profit Options Trading Chart For ThinkOrSwim
- Started by csricksdds
- Replies: 37
The Market Trading Game Changer
- Exclusive indicators
- Proven strategies & setups
- Private Discord community
- ‘Buy The Dip’ signal alerts
- Exclusive members-only content
- Add-ons and resources
- 1 full year of unlimited support
Frequently Asked Questions
useThinkScript is the #1 community of stock market investors using indicators and other tools to power their trading strategies. Traders of all skill levels use our forums to learn about scripting and indicators, help each other, and discover new ways to gain an edge in the markets.
We get it. Our forum can be intimidating, if not overwhelming. With thousands of topics, tens of thousands of posts, our community has created an incredibly deep knowledge base for stock traders. No one can ever exhaust every resource provided on our site.
If you are new, or just looking for guidance, here are some helpful links to get you started.
- The most viewed thread:
https://usethinkscript.com/threads/repainting-trend-reversal-for-thinkorswim.183/ - Our most popular indicator:
https://usethinkscript.com/threads/buy-the-dip-indicator-for-thinkorswim.3553/ - Answers to frequently asked questions:
https://usethinkscript.com/threads/answers-to-commonly-asked-questions.6006/