newnes_1976
New member
Hi, BenTen, I thank you in advance for any support.
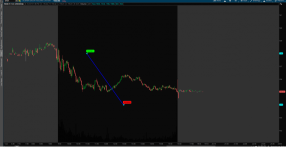
By example: Ticker BABA
im try to connect two this plots : "Test1" and "Test2" with a line, but i cant not do find the way.

Thank you very much and best regards
By example: Ticker BABA
im try to connect two this plots : "Test1" and "Test2" with a line, but i cant not do find the way.
Rich (BB code):
input DataU = 158.00;
input DataD = 154.00;

input Fibo1 = 1100;
def MA = SecondsFromTime(Fibo1);

def Nico1 = if Crosses(MA, open, CrossingDirection.ANY) then DataU  else Double.NaN;

plot Test1 = if Nico1 then DataU else Double.NaN;
Test1.SetPaintingStrategy(PaintingStrategy.POINTS);
Test1.SetLineWeight(5);
Test1.SetDefaultColor(Color.cyan);
AddChartBubble(Nico1, DataU,  "TEST1" , Color.green, yes );

input Fibo2 = 1300;
def ME = SecondsFromTime(Fibo2);

def Nico2 = if Crosses(ME, open, CrossingDirection.ANY) then DataD else Double.NaN;

plot Test2 = if Nico2 then DataD else Double.NaN;
Test2.SetPaintingStrategy(PaintingStrategy.POINTS);
Test2.SetLineWeight(5);
Test2.SetDefaultColor(Color.cyan);
AddChartBubble(Nico2, DataD,  "TEST2" , Color.red, yes );
Thank you very much and best regards
Attachments
Last edited by a moderator:

