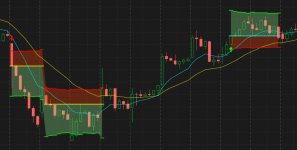
#avg_atr_rsi1
#https://usethinkscript.com/threads/help-moving-average-study.19870/
#Help Moving Average Study

# MovAvgExponential (CLOSE, 10, 0, no)
# MovAvgExponential (CLOSE, 25, 0, no)
# ATR (14, WILDERS)
# RIS (14, 70, 30, CLOSE, WILDERS, no)

def na = double.nan;
def bn = barnumber();
def o = open;
def c = close;
def grn = c > o;
def red = c < o;

#--------------------------------
# averages

input avg1_type = AverageType.exponential;
#input avg1_type = AverageType.Simple;
input avg1_length = 10;
def avg1 = MovingAverage(avg1_type, c, avg1_length );

input avg2_type = AverageType.exponential;
#input avg2_type = AverageType.Simple;
input avg2_length = 25;
def avg2 = MovingAverage(avg2_type, c, avg2_length );

input show_avg1_line = yes;
input show_avg2_line = yes;
plot zavg1 = if show_avg1_line then avg1 else na;
plot zavg2 = if show_avg2_line then avg2 else na;
zavg1.SetDefaultColor(Color.cyan);
zavg1.setlineweight(1);
zavg1.hidebubble();
zavg2.SetDefaultColor(Color.yellow);
zavg2.setlineweight(1);
zavg2.hidebubble();

def xup = avg1 crosses above avg2;
def xdwn = avg1 crosses below avg2;


# long rule1
#  ema10 > ema25
#  low > ema10 and green candle
def long1 = avg1 > avg2 and low > avg1 and grn and low[1] < avg1[1];

# short rule1
#  ema10 < ema25
#  high < ema10 and red candle
def short1 = avg1 < avg2 and high < avg1 and red and high[1] > avg1[1];

#--------------------------------

def y = 0.001;
plot zup = if long1 then (low*(1-y)) else na;
zup.SetPaintingStrategy(PaintingStrategy.ARROW_UP);
zup.SetDefaultColor(Color.green);
zup.setlineweight(3);
zup.hidebubble();

plot zdwn = if short1 then (high*(1+y)) else na;
zdwn.SetPaintingStrategy(PaintingStrategy.ARROW_DOWN);
zdwn.SetDefaultColor(Color.red);
zdwn.setlineweight(3);
zdwn.hidebubble();


addlabel(1, "  ", color.black);
addlabel(1,
     (if avg1_type == AverageType.Simple then "SMA"
 else if avg1_type == AverageType.exponential then "EMA"
 else if avg1_type == AverageType.hull then "HULL"
 else if avg1_type == AverageType.weighted then "WT"
 else if avg1_type == AverageType.wilders then "WILD"
 else "---")
+ avg1_length
, color.cyan);

addlabel(1, "  ", color.black);
addlabel(1,
     (if avg2_type == AverageType.Simple then "SMA"
 else if avg2_type == AverageType.exponential then "EMA"
 else if avg2_type == AverageType.hull then "HULL"
 else if avg2_type == AverageType.weighted then "WT"
 else if avg2_type == AverageType.wilders then "WILD"
 else "---")
+ avg2_length
, color.yellow);
addlabel(1, "  ", color.black);


#--------------------------------
# ATR

input length = 14;
input averageType = AverageType.WILDERS;
def ATR = MovingAverage(averageType, TrueRange(high, c, low), length);

#--------------------------------
# RSI

#declare lower;
input rsi_length = 14;
input rsi_over_Bought = 70;
input rsi_over_Sold = 30;
input rsi_price = close;
input rsi_averageType = AverageType.WILDERS;
#input showBreakoutSignals = no;

def NetChgAvg = MovingAverage(rsi_averageType, rsi_price - rsi_price[1], rsi_length);
def TotChgAvg = MovingAverage(rsi_averageType, AbsValue(rsi_price - rsi_price[1]), rsi_length);
def ChgRatio = if TotChgAvg != 0 then NetChgAvg / TotChgAvg else 0;

def RSI = 50 * (ChgRatio + 1);
def OverSold = rsi_over_Sold;
def OverBought = rsi_over_Bought;
def UpSignal = if RSI crosses above OverSold then OverSold else Double.NaN;
def DownSignal = if RSI crosses below OverBought then OverBought else Double.NaN;

addlabel(1, "  ", color.black);
addlabel(1, "RSI: " + floor(rsi), color.magenta);


#--------------------------------
# alerts , sounds

# alert(condition, text, alert type, sound);
# Sound.Ding,  higher , up sound
# Sound.Bell,  lower , down sound
alert(long1, "LONG" ,alert.BAR, sound.DING);
alert(short1, "SHORT" ,alert.BAR, sound.bell);

#--------------------------------
# buy lines for long and short

#  cancel = when close crosses buy line

def long_line = if long1 then close
 else if close[1] < long_line[1] then na
 else long_line[1];

plot zlline = long_line;
zlline.SetPaintingStrategy(PaintingStrategy.HORIZONTAL);
zlline.SetDefaultColor(Color.cyan);
zlline.setlineweight(2);
zlline.hidebubble();

def short_line = if short1 then close
 else if close[1] > short_line[1] then na
 else short_line[1];

plot zsline = short_line;
zsline.SetPaintingStrategy(PaintingStrategy.HORIZONTAL);
zsline.SetDefaultColor(Color.yellow);
zsline.setlineweight(2);
zsline.hidebubble();

#--------------------------------
# risk / reward

input risk_atr_factor = 1;
def risk = risk_atr_factor * atr;
input reward_factor = 2.0;
def reward = reward_factor * risk;

# LONG
def long_risk = if !isnan(long_line) then long_line - risk else na;
def long_reward = if !isnan(long_line) then long_line + reward else na;
plot z1 = long_risk;
plot z2 = long_reward;
z1.SetPaintingStrategy(PaintingStrategy.HORIZONTAL);
z1.SetDefaultColor(Color.red);
z1.setlineweight(2);
z2.SetPaintingStrategy(PaintingStrategy.HORIZONTAL);
z2.SetDefaultColor(Color.green);
z2.setlineweight(2);

def c1 = long_reward;
def c2 = zlline;
def c3 = long_risk;
addcloud(c1, c2, color.light_green);
addcloud(c2, c3, color.light_red);

# SHORT
def short_risk = if !isnan(short_line) then short_line + risk else na;
def short_reward = if !isnan(short_line) then short_line - reward else na;
plot z3 = short_risk;
plot z4 = short_reward;
z3.SetPaintingStrategy(PaintingStrategy.HORIZONTAL);
z3.SetDefaultColor(Color.red);
z3.setlineweight(2);
z4.SetPaintingStrategy(PaintingStrategy.HORIZONTAL);
z4.SetDefaultColor(Color.green);
z4.setlineweight(2);

def c4 = short_reward;
def c5 = zsline;
def c6 = short_risk;
addcloud(c5, c4, color.light_green);
addcloud(c6, c5, color.light_red);
#

