I've now spent several hours attempting to make this work and just can't seem to make it happen. When I've gotten really close I've gotten an error that doesn't make sense telling me I'm looking for a negative index over -2,000. My barsBack variable was set at 100, so I don't understand why it kept telling me I was exceeding 2000 bars forward. That's when I decided I needed some help.
Here are the rules.
1. The line should only appear when the double top (DT) occurs with the last bar on the chart. As soon as the next bar prints and it is no longer a DT with a prior bar, the line should disappear.
2. I'm only looking for EXACT DTs (high == high).
3. I only want DTs that occur "in the clear". What I mean is, if you trace the high of the current bar back to the left, as soon as you encounter prices that engulf that level it should no longer search for DTs to draw a line. I call it an intercept, but what I mean is: high[x_back] > high and low[x_back] < high.
I've tried multiple variations. I have not included the isInterceptHigh and isInterceptLow because that's where I was getting an error, so this is the current version in progress.
Ruby:
### DECLARATIONS
declare upper;


### INPUTS
input barsBack = 100;


### DEFINITIONS
def isLastBar = !IsNaN(close) and IsNaN(close[-1]);

def isInterceptHigh =
    if isLastBar then
        fold ih = 1 to barsBack + 1
        with h = Double.NaN
        while high >= GetValue(high, ih)
        do
            if Getvalue(high, ih) > high
            then ih
            else Double.NaN
    else
        Double.NaN;

def isInterceptLow =
    if isLastBar then
        fold il = 1 to barsBack + 1
        with l = Double.NaN
        while low <= GetValue(high, il)
        do
            if Getvalue(low, il) < low
            then il
            else Double.NaN
    else
        Double.NaN;

def isTopTail = high[1] < high and high > high[-1];
def isBottomTail = low[1] > low and low < low[-1];

def lastHigh = if isLastBar then high else lastHigh[1];
def highLineValue = if isNaN(close[-barsBack]) then lastHigh[-barsBack] else Double.NaN;

def lastLow = if isLastBar then low else lastLow[1];
def lowLineValue = if isNaN(close[-barsBack]) then lastLow[-barsBack] else Double.NaN;

def isDT = if isLastBar or (isTopTail and high == highLineValue) then high else Double.NaN;
def isDB = if isLastBar or (isBottomTail and low == lowLineValue) then low else Double.NaN;


### PLOTS
plot DT = isDT;

plot DB = isDB;


# This plot forces the repaint of historic bars by offsetting a plot into the future.  Without this the study will not recalculate historical bars.
plot forceBarRepaint = close[-barsBack] * Double.NaN;


### FORMATTING
DT.EnableApproximation();
DT.SetPaintingStrategy(PaintingStrategy.HORIZONTAL);
DT.SetDefaultColor(Color.RED);
DT.HideBubble();
DT.HideTitle();

DB.EnableApproximation();
DB.SetPaintingStrategy(PaintingStrategy.HORIZONTAL);
DB.SetDefaultColor(Color.GREEN);
DB.HideBubble();
DB.HideTitle();
I've now spent several hours attempting to make this work and just can't seem to make it happen. When I've gotten really close I've gotten an error that doesn't make sense telling me I'm looking for a negative index over -2,000. My barsBack variable was set at 100, so I don't understand why it kept telling me I was exceeding 2000 bars forward. That's when I decided I needed some help.
Here are the rules.
1. The line should only appear when the double top (DT) occurs with the last bar on the chart. As soon as the next bar prints and it is no longer a DT with a prior bar, the line should disappear.
2. I'm only looking for EXACT DTs (high == high).
3. I only want DTs that occur "in the clear". What I mean is, if you trace the high of the current bar back to the left, as soon as you encounter prices that engulf that level it should no longer search for DTs to draw a line. I call it an intercept, but what I mean is: high[x_back] > high and low[x_back] < high.
this isn't exactly as requested,
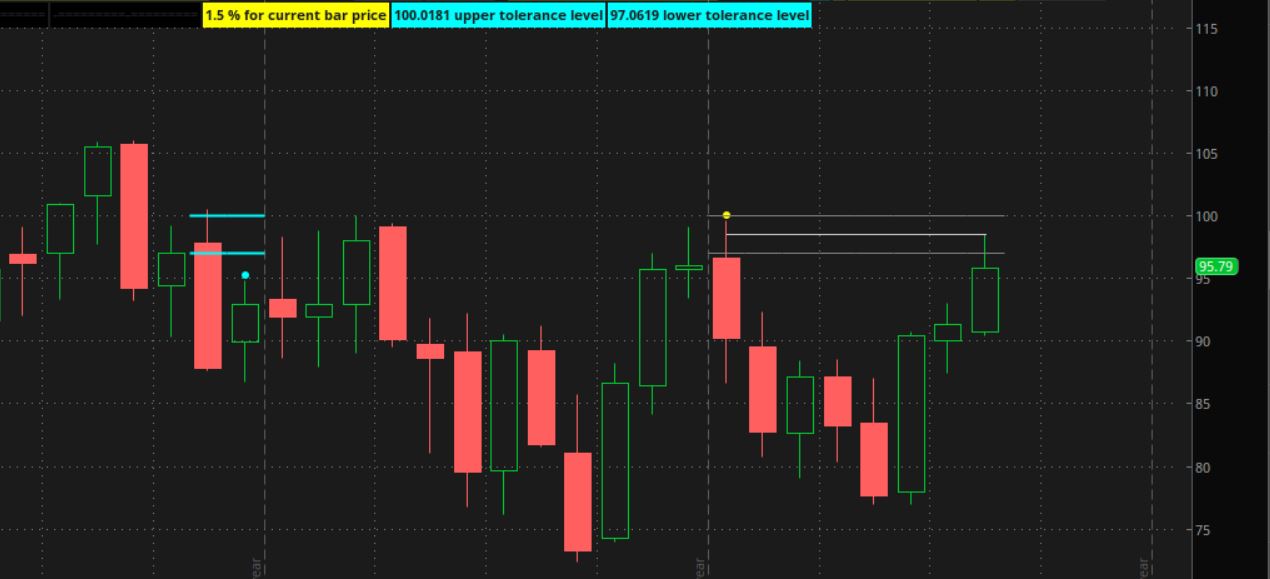
i thought an exact match would be very rare, so i made this with 2 tolerance lavels, above and below the last price.
this finds the price of the last bar.
pick a % tolerance, to create upper and lower levels, around the last price. (default 1.5%)
check all the bars, to find when/if price crosses down , through the tolerance levels (cross down). find the most recent occurance.
looks for a bar price that is within the tolerance levels (double top). find most recent occurance.
draws 3 gray lines for double top lines, 2 tolerance and 1 price level.
draws 2 cyan lines when a cross down happens
can show dots above bars when the cross down happens and the double top bar.
i didn't check if no valid data. so long lines might be visible sometimes.
Code:
#same_high_line_00

# test -  EMR  month chart

#https://usethinkscript.com/threads/help-making-double-top-with-last-bar-only-indicator.16253/
#Help making double top with last bar only indicator

#1. The line should only appear when the double top (DT) occurs with the last bar on the chart. As soon as the next bar prints and it is no longer a DT with a prior bar, the line should disappear.
#2. I'm only looking for EXACT DTs (high == high).
#3. I only want DTs that occur "in the clear". What I mean is, if you trace the high of the current bar back to the left, as soon as you encounter prices that engulf that level it should no longer search for DTs to draw a line.

def na = double.nan;
def bn = barnumber();

# find last bar
def lastbn = HighestAll(If(IsNaN(close), 0, bn));
def lastbar = if (bn == lastbn) then 1 else 0;
#def lastbar = !isnan(close[0]) and isnan(close[-1]);

# get price from last bar, to match to a prev bar
input price = high;
# set the current price to a var, across all bars
def last_price = HighestAll(if lastbn == bn then price else 0);

input price_tol_percent = 1.5;
def tolhi = last_price * (1 + (price_tol_percent/100));
def tollo = last_price * (1 - (price_tol_percent/100));

addlabel(1, price_tol_percent + " % for current bar price", color.yellow);
addlabel(1, tolhi + " upper tolerance level", color.cyan);
addlabel(1, tollo + " lower tolerance level", color.cyan);


# look for a bar thet crosses down over the tolerance levels
def crossdownbn = if bn == 1 then 0
# else if (high > tolhi and low < tollo) or (high[1] > tolhi and low < tollo) then bn
 else if (high[1] > tolhi and low < tollo) then bn
 else crossdownbn[1];

# find bn of most recent cross down
def crossdownrecent = highestall(crossdownbn);

# define a group of bars to draw lines for cross down bar
def crosslines = if bn >= (crossdownrecent - 1) and bn <= (crossdownrecent + 0) then 1 else 0;


# look for a match to last bar price
#  find price within tol levels
def matchbn = if crossdownrecent > 0 and bn != lastbn and bn > crossdownrecent and (price < tolhi and price > tollo) then bn else 0;
def matchbnhi = highestall(matchbn);

# define a group of bars for double top to draw lines
def dbllines = if bn >= matchbnhi and bn <= lastbn then 1 else 0;


# draw line from current bar price
input show_tol_lines = yes;
plot zt0 = if show_tol_lines and dbllines then last_price else na;
zt0.SetDefaultColor(Color.light_gray);
zt0.hidebubble();


# tolerance lines
plot zt1 = if show_tol_lines and dbllines then tolhi else na;
zt1.SetPaintingStrategy(PaintingStrategy.HORIZONTAL);
zt1.SetDefaultColor(Color.gray);
zt1.hidebubble();
plot zt2 = if show_tol_lines and dbllines then tollo else na;
zt2.SetPaintingStrategy(PaintingStrategy.HORIZONTAL);
zt2.SetDefaultColor(Color.gray);
zt2.hidebubble();


# cross down lines , when bars cross down, over the tolerance levels
input show_cross_down_lines = yes;
plot xt1 = if show_cross_down_lines and crosslines then tolhi else na;
xt1.SetPaintingStrategy(PaintingStrategy.HORIZONTAL);
xt1.SetDefaultColor(Color.cyan);
xt1.setlineweight(2);
xt1.hidebubble();
plot xt2 = if show_cross_down_lines and crosslines then tollo else na;
xt2.SetPaintingStrategy(PaintingStrategy.HORIZONTAL);
xt2.SetDefaultColor(Color.cyan);
xt2.setlineweight(2);
xt2.hidebubble();


input show_cross_down_dot = yes;
plot zw1 = if show_cross_down_dot and bn == crossdownrecent then high * 1.004 else na;
zw1.SetPaintingStrategy(PaintingStrategy.POINTS);
zw1.SetDefaultColor(Color.cyan);
zw1.setlineweight(3);
zw1.hidebubble();


input show_match_dot = yes;
plot zw2 = if show_match_dot and bn ==  matchbnhi then high * 1.004 else na;
zw2.SetPaintingStrategy(PaintingStrategy.POINTS);
zw2.SetDefaultColor(Color.yellow);
zw2.setlineweight(3);
zw2.hidebubble();


#------------------
# test stuff

input test1 = no;
addchartbubble(test1, low*0.999,
bn + " bn\n" +
lastbn + " Lbn\n" +
last_price + " last"
, color.yellow, no);


input test2_crossdown = no;
addchartbubble(test2_crossdown and (bn == crossdownbn), low,
crossdownbn + "\n" +
crossdownrecent
, color.cyan, no);


input test3_match = no;
addchartbubble(test3_match and (bn == matchbn), low,
matchbn + "\n" +
matchbnhi
, color.yellow, no);

#
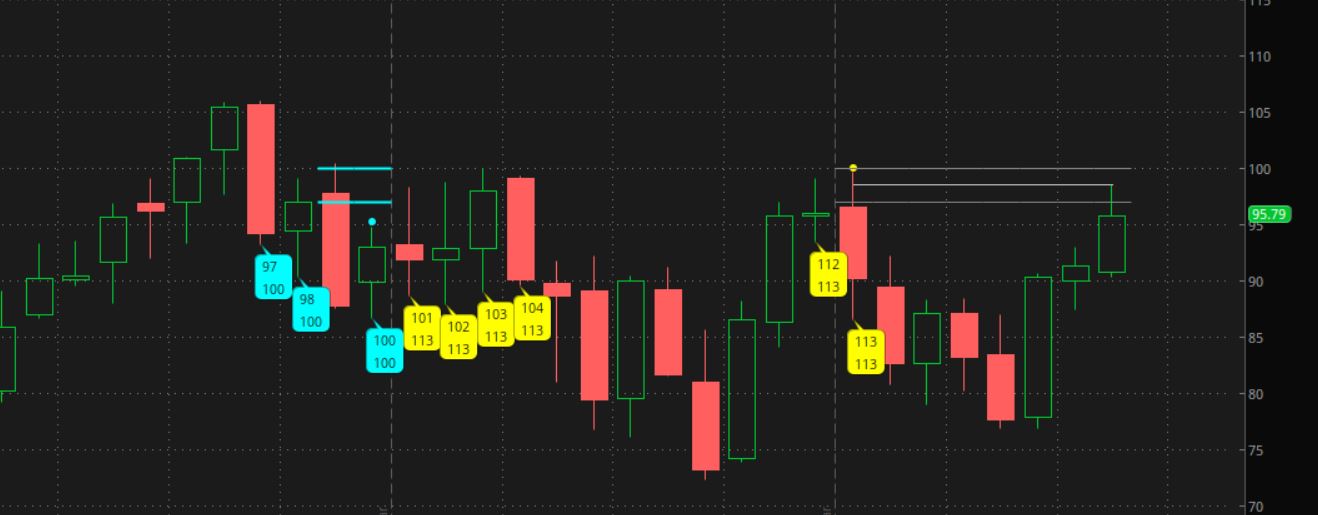
EMR - month
shows test bubbles, on cross down bars and double top bars
@halcyonguy, first... thank you for the attempt. I don't know that this will work though for a couple reasons.
1. I AM looking for exact high matches. Trading the ES, this is very important and happens several times per day. I can see how you may not get that with stocks though, so leaving an input for tolerance might work so it could be set to 0 ticks or something.
2. You use HighestAll, which means it will not calculate while the bar is forming. This will need to function on every tick, not only when the chart is redrawn.
Do you think you would be able to make it work in that way?
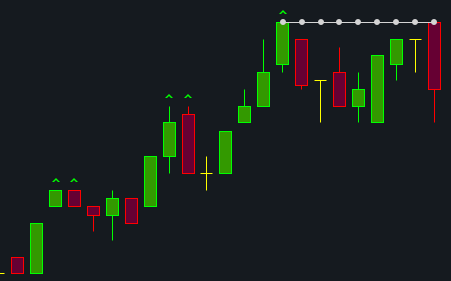
A reversal size of 2 defines a "top" as a center bar with the 2 bars to the left of it, and the 2 bars to the right of it, not being higher than the center bar itself. This would be a five bar pattern. A reversal size of 1 would be a three bar pattern, and so on.
Update range is how far from the right edge of the chart it will potentially start painting the line, and also causes the repaint to remove older lines which are no longer valid. I believe we discussed this in another thread if you recall, it's basically the same thing.
Code:
Input RevSize = 2;
Input UpdateRange = 100;
def Edge =
    isNaN(Close[-1]) and !IsNaN(Close);
def HM =
    high[RevSize] == highest(high,RevSize * 2 + 1);
def HMV =
    if HM then High[RevSize] else HMV[1];
def DT =
    if Edge then Fold Index = 1 to Max(1,BarNumber())
    with Data = 0 while Data == 0 do
    if GetValue(High,Index) > High then -1
    else if GetValue(HMV,Index) == High and GetValue(HM,Index)
    then Index + RevSize
    else Data else No;
def BarRem =
    if isNaN(close[-UpdateRange])
    then UpdateRange - Sum(isNaN(close[-UpdateRange]),UpdateRange)
    else Double.NaN;
def Seek =
    GetValue(DT,-BarRem) == BarRem;
def Level =
    if Seek then high else Level[1];
plot Line =
    if Level then Level Else Double.NaN;
Changing the last line to plot Line = Level != 0; will go through as a scan to find test samples, but this happens so rarely that you've got to open it up to All Symbols, and you'll likely just run into a lot of illiquid dot-dash-trash type price action.
this isn't exactly as requested,
i thought an exact match would be very rare, so i made this with 2 tolerance lavels, above and below the last price.
this finds the price of the last bar.
pick a % tolerance, to create upper and lower levels, around the last price. (default 1.5%)
check all the bars, to find when/if price crosses down , through the tolerance levels (cross down). find the most recent occurance.
looks for a bar price that is within the tolerance levels (double top). find most recent occurance.
draws 3 gray lines for double top lines, 2 tolerance and 1 price level.
draws 2 cyan lines when a cross down happens
can show dots above bars when the cross down happens and the double top bar.
i didn't check if no valid data. so long lines might be visible sometimes.
Code:
#same_high_line_00

# test -  EMR  month chart

#https://usethinkscript.com/threads/help-making-double-top-with-last-bar-only-indicator.16253/
#Help making double top with last bar only indicator

#1. The line should only appear when the double top (DT) occurs with the last bar on the chart. As soon as the next bar prints and it is no longer a DT with a prior bar, the line should disappear.
#2. I'm only looking for EXACT DTs (high == high).
#3. I only want DTs that occur "in the clear". What I mean is, if you trace the high of the current bar back to the left, as soon as you encounter prices that engulf that level it should no longer search for DTs to draw a line.

def na = double.nan;
def bn = barnumber();

# find last bar
def lastbn = HighestAll(If(IsNaN(close), 0, bn));
def lastbar = if (bn == lastbn) then 1 else 0;
#def lastbar = !isnan(close[0]) and isnan(close[-1]);

# get price from last bar, to match to a prev bar
input price = high;
# set the current price to a var, across all bars
def last_price = HighestAll(if lastbn == bn then price else 0);

input price_tol_percent = 1.5;
def tolhi = last_price * (1 + (price_tol_percent/100));
def tollo = last_price * (1 - (price_tol_percent/100));

addlabel(1, price_tol_percent + " % for current bar price", color.yellow);
addlabel(1, tolhi + " upper tolerance level", color.cyan);
addlabel(1, tollo + " lower tolerance level", color.cyan);


# look for a bar thet crosses down over the tolerance levels
def crossdownbn = if bn == 1 then 0
# else if (high > tolhi and low < tollo) or (high[1] > tolhi and low < tollo) then bn
 else if (high[1] > tolhi and low < tollo) then bn
 else crossdownbn[1];

# find bn of most recent cross down
def crossdownrecent = highestall(crossdownbn);

# define a group of bars to draw lines for cross down bar
def crosslines = if bn >= (crossdownrecent - 1) and bn <= (crossdownrecent + 0) then 1 else 0;


# look for a match to last bar price
#  find price within tol levels
def matchbn = if crossdownrecent > 0 and bn != lastbn and bn > crossdownrecent and (price < tolhi and price > tollo) then bn else 0;
def matchbnhi = highestall(matchbn);

# define a group of bars for double top to draw lines
def dbllines = if bn >= matchbnhi and bn <= lastbn then 1 else 0;


# draw line from current bar price
input show_tol_lines = yes;
plot zt0 = if show_tol_lines and dbllines then last_price else na;
zt0.SetDefaultColor(Color.light_gray);
zt0.hidebubble();


# tolerance lines
plot zt1 = if show_tol_lines and dbllines then tolhi else na;
zt1.SetPaintingStrategy(PaintingStrategy.HORIZONTAL);
zt1.SetDefaultColor(Color.gray);
zt1.hidebubble();
plot zt2 = if show_tol_lines and dbllines then tollo else na;
zt2.SetPaintingStrategy(PaintingStrategy.HORIZONTAL);
zt2.SetDefaultColor(Color.gray);
zt2.hidebubble();


# cross down lines , when bars cross down, over the tolerance levels
input show_cross_down_lines = yes;
plot xt1 = if show_cross_down_lines and crosslines then tolhi else na;
xt1.SetPaintingStrategy(PaintingStrategy.HORIZONTAL);
xt1.SetDefaultColor(Color.cyan);
xt1.setlineweight(2);
xt1.hidebubble();
plot xt2 = if show_cross_down_lines and crosslines then tollo else na;
xt2.SetPaintingStrategy(PaintingStrategy.HORIZONTAL);
xt2.SetDefaultColor(Color.cyan);
xt2.setlineweight(2);
xt2.hidebubble();


input show_cross_down_dot = yes;
plot zw1 = if show_cross_down_dot and bn == crossdownrecent then high * 1.004 else na;
zw1.SetPaintingStrategy(PaintingStrategy.POINTS);
zw1.SetDefaultColor(Color.cyan);
zw1.setlineweight(3);
zw1.hidebubble();


input show_match_dot = yes;
plot zw2 = if show_match_dot and bn ==  matchbnhi then high * 1.004 else na;
zw2.SetPaintingStrategy(PaintingStrategy.POINTS);
zw2.SetDefaultColor(Color.yellow);
zw2.setlineweight(3);
zw2.hidebubble();


#------------------
# test stuff

input test1 = no;
addchartbubble(test1, low*0.999,
bn + " bn\n" +
lastbn + " Lbn\n" +
last_price + " last"
, color.yellow, no);


input test2_crossdown = no;
addchartbubble(test2_crossdown and (bn == crossdownbn), low,
crossdownbn + "\n" +
crossdownrecent
, color.cyan, no);


input test3_match = no;
addchartbubble(test3_match and (bn == matchbn), low,
matchbn + "\n" +
matchbnhi
, color.yellow, no);

#
EMR - month
shows test bubbles, on cross down bars and double top bars
useThinkScript is the #1 community of stock market investors using indicators and other tools to power their trading strategies. Traders of all skill levels use our forums to learn about scripting and indicators, help each other, and discover new ways to gain an edge in the markets.
How do I get started?
We get it. Our forum can be intimidating, if not overwhelming. With thousands of topics, tens of thousands of posts, our community has created an incredibly deep knowledge base for stock traders. No one can ever exhaust every resource provided on our site.
If you are new, or just looking for guidance, here are some helpful links to get you started.
VIP members get exclusive access to these proven and tested premium indicators: Buy the Dip, Advanced Market Moves 2.0, Take Profit, and Volatility Trading Range. In addition, VIP members get access to over 50 VIP-only custom indicators, add-ons, and strategies, private VIP-only forums, private Discord channel to discuss trades and strategies in real-time, customer support, trade alerts, and much more. Learn all about VIP membership here.
How can I access the premium indicators?
To access the premium indicators, which are plug and play ready, sign up for VIP membership here.