Hello, I’m new to ToS and already see how powerful it is. I’d like help creating a Equal Highs and Lows study to find symbols that have on their chart this setup. Maybe such an indicator already exists or something close that I can build on. I tried to build this by myself, but ran into the problem that ToS cannot completely delete already broken Equal High/Lows, and they ended up in the screener or in the watchlist column.
Goal: detect setups where price forms equal swing highs or lows
This would be used for stocks. It can be used in wathlist column, or to scan, does'n matter, but first at leas to get start.
Requirements:
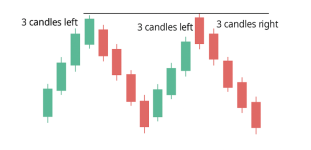
This is how pattern look like visually what screener must find.
I would be very grateful for any help.
Goal: detect setups where price forms equal swing highs or lows
This would be used for stocks. It can be used in wathlist column, or to scan, does'n matter, but first at leas to get start.
Requirements:
- Scan on 1-minute timeframe
- Use only today’s session bars , starting from premarket
- Define a swing point (“peak”):
- High peak: highest high vs 3 bars left and right
- Low peak: lowest low vs 3 bars left and right
- Confirm after 3 bars to the right (detection delay)
- Equal high/low detection:
- Round prices to 2 decimals (e.g. 216.351 → 216.35)
- Group peaks by rounded price
- Plot horizontal lines where 2 or more equal peaks occur
- Detect only unbroken grouped peaks (price hasn’t crossed the line yet) I don’t want to see EQH/L that are already broken, only this that was not broken yet.
- In settings can be configured to display values greater than 2 or to choose to display value greater than 3 equal highs/lows.
This is how pattern look like visually what screener must find.
I would be very grateful for any help.