Green Hulk For ThinkOrSwim

sky4blue

New member
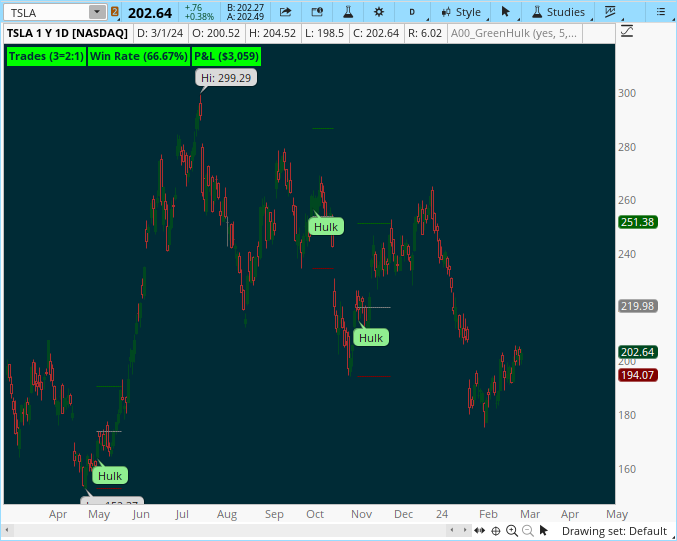
This study looks for:
  • MACD is crossing up
  • Stochastic between 20 and 80
  • Stochastic recently below 20 (last 10 bars)
  • RSI above the MA

Oscillators are the best trading tool when an instrument is trending.

The author states:
// The Hulk has been many colors, other than green. But this is entitled Green Hulk, due to only LONGs with this strategy
// This strategy works best on DAILY candles. One hour was ok, but anything lower than an hour candle performed poorly
YAe23tq.png


Please convert:
https://github.com/TraderOracle/TradingView/blob/main/GreenHulk.txt
// Movivated by this video by Serious Backtester:
 
Last edited by a moderator:

Join useThinkScript to post your question to a community of 21,000+ developers and traders.

Convert Tradingview Green Hulk
https://github.com/TraderOracle/TradingView/blob/main/GreenHulk.txt

//@version=4
study(title = "Green Hulk", overlay=true, format=format.price, precision=2)

// Movivated by this video by Serious Backtester:
// The Hulk has been many colors, other than green. But this is entitled Green Hulk, due to only LONGs with this strategy
// This strategy works best on DAILY candles. One hour was ok, but anything lower than an hour candle performed poorly

// MACD
[currMacd,,] = macd(close[0], 12, 26, 9)
[prevMacd,,] = macd(close[1], 12, 26, 9)
signal = ema(currMacd, 9)

// STOCHASTIC RSI
rsiSR = rsi(close, 14)
kSR = sma(stoch(rsiSR, rsiSR, rsiSR, 14), 3)
dSR = sma(kSR, 3)

// RSI with moving average
up = rma(max(change(close), 0), 14)
down = rma(-min(change(close), 0), 14)
rsi = down == 0 ? 100 : up == 0 ? 0 : 100 - (100 / (1 + up / down))
rsiMA = ema(rsi, 14)

// If MACD is crossing up
macdGood = (cross(currMacd, signal) and currMacd > signal and currMacd <= 2)
// And Stochastic between 20 and 80
stochGood = dSR > 19 and dSR < 80
// And Stochastic recently below 20 (last 10 bars)
stochRecent = dSR[1] < 20 or dSR[2] < 20 or dSR[3] < 20 or dSR[4] < 20 or dSR[5] < 20 or dSR[6] < 20 or dSR[7] < 20 or dSR[8] < 20 or dSR[9] < 20
// And RSI above the MA
rsiGood = rsi > rsiMA

buySignal = macdGood and stochGood and stochRecent and rsiGood
buyMe = buySignal and not buySignal[1]

plotshape(buyMe ? close : na, title="Hulk", text="Hulk", location=location.belowbar, style=shape.labelup, size=size.tiny, color=color.rgb(40, 154, 71), textcolor=color.white)

// Find swing low from past 10 candles
low_10 = lowest(close, 10)
// STOP = swing low, TP = 1.5 profit factor
plotshape(buyMe ? abs(low - low_10) * 1.5 + high : na, title='ATR ceiling', color=color.lime, style=shape.xcross, size=size.tiny, location=location.absolute)
plotshape(buyMe ? low_10 : na, title='ATR floor', color=color.red, style=shape.xcross, size=size.tiny, location=location.absolute)
check the below:

CSS:
#//@version=4
#study(title = "Green Hulk", overlay=true, format=format.price, precision=2)
#// Movivated by this video by Serious Backtester: https://www.youtube.com/watch?v=lXYGrhZcYBc
#// The Hulk has been many colors, other than green.  But this is entitled Green Hulk, due to only LONGs with this strategy
#// This strategy works best on DAILY candles.  One hour was ok, but anything lower than an hour candle performed poorly
# - Converted by Sam4Cok@Samer800    - 03/2024

input showInfoLabel = yes;
input MinBarsBetweenTrades = 5;
input averageType = AverageType.EXPONENTIAL;
input macdFastLength = 12;
input macdSlowLength = 26;
input macdSignalLength = 9;
input rsiLength = 14;
input stochLength = 14;
input showTpAndSlLines = yes;
input lotSize = 100;
input profitFactor = 1.5;

def na = Double.NaN;
def bar = if !isNaN(close) then BarNumber() else bar[1];
# stoch(source, high, low, length) =>
script stoch {
    input src = close;
    input h = high;
    input l = low;
    input len = 14;
    def hh = Highest(h, len);
    def ll = Lowest(l, len);
    def stoch = 100 * (src - ll) / (hh - ll);
    plot return = stoch;
}
#// MACD
def Value = MovingAverage(averageType, close, macdFastLength) - MovingAverage(averageType, close, macdSlowLength);
def currMacd = Value;
def signal = MovingAverage(averageType, Value, macdSignalLength);

#// STOCHASTIC RSI
def rsiSR = RSI(Price = close, Length = rsiLength);
def kSR = Average(stoch(rsiSR, rsiSR, rsiSR, stochLength), 3);
def dSR = Average(kSR, 3);
#// RSI with moving average
def rsiMA = MovingAverage(averageType, rsiSR, stochLength);

#// If MACD is crossing up
def macdGood = (crosses(currMacd, signal) and currMacd > signal and currMacd <= 2);
#// And Stochastic between 20 and 80
def stochGood = dSR > 19 and dSR < 80;
#// And Stochastic recently below 20 (last 10 bars)
def stochRecent = dSR[1] < 20 or dSR[2] < 20 or dSR[3] < 20 or dSR[4] < 20 or dSR[5] < 20 or dSR[6] < 20 or dSR[7] < 20 or dSR[8] < 20 or dSR[9] < 20;
#// And RSI above the MA
def rsiGood = rsiSR > rsiMA;

def buySignal = macdGood and stochGood and stochRecent and rsiGood;
def buyMe = bar > 0 and buySignal and !buySignal[1];
def gap = if buyMe then 0 else gap[1] + 1;
def GreenHulk = buyMe and gap[1] >= MinBarsBetweenTrades;
#// Find swing low from past 10 candles
def low_10 = Lowest(low, 10);
#// STOP = swing low, TP = 1.5 profit factor
def TP; def SL;def entry;def cntTrade;
if GreenHulk {
    cntTrade = cntTrade[1] + 1;
    entry = open[-1];
    TP = AbsValue(low - low_10) * profitFactor + entry;
    SL = low_10;
    } else {
    cntTrade = if isNaN(cntTrade[1]) then 0 else cntTrade[1];
    TP = if (high > TP[1] or low < SL[1]) then na else TP[1];
    SL = if (high > TP[1] or low < SL[1]) then na else SL[1];
    entry = if (!isNaN(TP) and !isNaN(SL)) then entry[1] else na;
}

plot entryLine = if showTpAndSlLines and entry then entry else na;
plot TPLine = if showTpAndSlLines and TP then TP else na;
plot SLLine = if showTpAndSlLines and SL then SL else na;

entryLine.SetPaintingStrategy(PaintingStrategy.DASHES);
TPLine.SetPaintingStrategy(PaintingStrategy.DASHES);
SLLine.SetPaintingStrategy(PaintingStrategy.DASHES);

entryLine.SetDefaultColor(Color.GRAY);
TPLine.SetDefaultColor(Color.DARK_GREEN);
SLLine.SetDefaultColor(Color.DARK_RED);

AddChartBubble(GreenHulk, low, "Hulk", Color.LIGHT_GREEN, no);

def cond = if !isNaN(entry) and !isNaN(entry[-1]) then entry!=entry[-1] else 0;
def end = isNaN(entry) and !isNaN(entry[1]) or cond;

def PL = if isNaN(PL[1]) then 0 else
         if end[-1] then PL[1] + ((close - entry) * lotSize) else PL[1];
def totWin = if isNaN(totWin[1]) then 0 else
             if end[-1] then if (close - entry) > 0 then totWin[1] + 1 else totWin[1] else totWin[1];
def totLos = if isNaN(totLos[1]) then 0 else
             if end[-1] then if (close - entry) < 0 then totLos[1] + 1 else totLos[1] else totLos[1];

def winRate = Round(totWin /  cntTrade  * 100, 2);
def PandL = Round(PL, 2);
AddLabel(showInfoLabel, "Trades (" + cntTrade + "=" + totWin + ":" + totLos + ")", if totWin>totLos then Color.GREEN else
                                                                       if totWin<totLos then Color.RED else Color.GRAY);
AddLabel(showInfoLabel,"Win Rate (" + winRate + "%)",  if winRate>50 then Color.GREEN else
                                          if winRate<50 then Color.RED else Color.GRAY);
AddLabel(showInfoLabel,"P&L ($"+ PandL + ")", if PandL>0 then Color.GREEN else
                                  if PandL<0 then Color.RED else Color.GRAY);


#-- ENF of CODE
 
Hello,

If it's possible would like to see the most current SLLINE and ENTRYLINE. Also, if it is possible would like to expand the SLLINE and ENTRYLINE on chart.


Thank you,


1712173079918.png


Code:
#study(title = "Green Hulk", overlay=true, format=format.price, precision=2)
#// Movivated by this video by Serious Backtester: https://www.youtube.com/watch?v=lXYGrhZcYBc
#// The Hulk has been many colors, other than green.  But this is entitled Green Hulk, due to only LONGs with this strategy
#// This strategy works best on DAILY candles.  One hour was ok, but anything lower than an hour candle performed poorly
# - Converted by Sam4Cok@Samer800    - 03/2024
input ShowMarketHours = no;
input MinBarsBetweenTrades = 5;
input profitFactor = 1.5;
input showTpAndSlLines = no;


def na = Double.NaN;
def bar = if !IsNaN(close) then BarNumber() else bar[1];


def stochasticcrossover = StochasticFull("k period" = 70, "slowing period" = 10) is less than 35;
def signal_buy = MACD("macd length" = 10) is less than 0;
def ema_check_buy = close < MovavgExponential(length = 200);
def crossover_buy = MACDHistogramCrossover("macd length" = 10, "crossing type" = "negative to positive") is true ;


def buySignal = stochasticcrossover and ema_check_buy and signal_buy and crossover_buy;
def marketHours = if SecondsTillTime(0930) <= 0 and SecondsTillTime(1600) > 0 then 1 else 0;


def plotBuy;
if ShowMarketHours == yes { plotBuy = buySignal and marketHours;} else { plotBuy = buySignal;}


Plot Buy = if plotBuy then 1 else 0;


Buy.SetPaintingStrategy(PaintingStrategy.BOOLEAN_ARROW_UP);
Buy.SetDefaultColor(Color.YELLOW);
Buy.SetLineWeight(3);


def buy_signal = if plotBuy then 1 else 0;


############################# - Converted by Sam4Cok@Samer800    - 03/2024
##############################


def buyMe = bar > 0 and buySignal and !buySignal[1];
def gap = if buyMe then 0 else gap[1] + 1;
def GreenHulk = buyMe and gap[1] >= MinBarsBetweenTrades;
#// Find swing low from past 10 candles
def low_10 = Lowest(low, 10);
#// STOP = swing low, TP = 1.5 profit factor
def TP;
def SL;
def entry;
def cntTrade;
if GreenHulk {
    cntTrade = cntTrade[1] + 1;
    entry = open[-1];
    TP = AbsValue(low - low_10) * profitFactor + entry;
    SL = low_10;
} else {
    cntTrade = if IsNaN(cntTrade[1]) then 0 else cntTrade[1];
    TP = if (high > TP[1] or low < SL[1]) then na else TP[1];
    SL = if (high > TP[1] or low < SL[1]) then na else SL[1];
    entry = if (!IsNaN(TP) and !IsNaN(SL)) then entry[1] else na;
}


plot SLLine = if showTpAndSlLines and SL then SL else na;
SLLine.SetPaintingStrategy(PaintingStrategy.DASHES);
SLLine.SetDefaultColor(Color.black);
SLLine.SetLineWeight(2);


plot entryLine = if showTpAndSlLines and entry then entry else na;
entryLine.SetPaintingStrategy(PaintingStrategy.DASHES);
entryLine.SetDefaultColor(Color.black);
entryLine.SetLineWeight(2);


################################################################
################################################################


# Define the most recent entry price
def recentEntry = if !IsNaN(entry) and IsNaN(entry[1]) then entry else recentEntry[1];


# Determine if the current close is above or below the most recent entry
def waitSignal = if !IsNaN(recentEntry) and close < recentEntry then 1 else 0;


# Add the label with appropriate colors
AddLabel(yes, if !IsNaN(recentEntry) and !waitSignal then "Buy Signal" else "Wait and Watch",
         if !IsNaN(recentEntry) and !waitSignal then Color.GREEN else Color.GRAY);


##################################################################
##################################################################


Update
4/17/24


looking through threads managed to find a solution to show only the current signal (arrow up), SLLINE and ENTRYLINE ----- - Now I am having an issue trying to extend SLLINE and ENTRYLINE horizontal lines.

Thank you.

credit to David45 and SleepZ.


Code:
################################################
## https://usethinkscript.com/threads/code-to-plot-current-signal-only.8940/ -From: David45 - " Figured it out! I used some code that SleepyZ helped me with for another indicator and it worked on this one too! So Kudos to SleepyZ!"


input Count = 1;


def Buy1 = if plotBuy then 1 else 0;


def dataCount = CompoundValue(1, if plotBuy then dataCount[1] + 1 else dataCount[1], 0);
def limitplot = dataCount == HighestAll(dataCount);


input showarrows = yes;
plot Buy = showarrows and Buy1 > 0 and Buy1[1] <= 0 and limitplot;


Buy.SetPaintingStrategy(PaintingStrategy.BOOLEAN_ARROW_UP);
Buy.SetDefaultColor(Color.YELLOW);
Buy.SetLineWeight(3);


def buy_signal = if plotBuy then 1 else 0;


############################################
############################################
plot SLLine = if showTpAndSlLines and limitplot and SL then SL else na;
SLLine.SetPaintingStrategy(PaintingStrategy.DASHES);
SLLine.SetDefaultColor(Color.black);
SLLine.SetLineWeight(2);


plot entryLine = if showTpAndSlLines and limitplot and entry then entry else na;
entryLine.SetPaintingStrategy(PaintingStrategy.DASHES);
entryLine.SetDefaultColor(Color.black);
entryLine.SetLineWeight(2);

###################################################
###################################################


1713371788071.png

#
 
Last edited:

Similar threads

Not the exact question you're looking for?

Start a new thread and receive assistance from our community.

87k+ Posts
436 Online
Create Post

Similar threads

Similar threads

The Market Trading Game Changer

Join 2,500+ subscribers inside the useThinkScript VIP Membership Club
  • Exclusive indicators
  • Proven strategies & setups
  • Private Discord community
  • ‘Buy The Dip’ signal alerts
  • Exclusive members-only content
  • Add-ons and resources
  • 1 full year of unlimited support

Frequently Asked Questions

What is useThinkScript?

useThinkScript is the #1 community of stock market investors using indicators and other tools to power their trading strategies. Traders of all skill levels use our forums to learn about scripting and indicators, help each other, and discover new ways to gain an edge in the markets.

How do I get started?

We get it. Our forum can be intimidating, if not overwhelming. With thousands of topics, tens of thousands of posts, our community has created an incredibly deep knowledge base for stock traders. No one can ever exhaust every resource provided on our site.

If you are new, or just looking for guidance, here are some helpful links to get you started.

What are the benefits of VIP Membership?
VIP members get exclusive access to these proven and tested premium indicators: Buy the Dip, Advanced Market Moves 2.0, Take Profit, and Volatility Trading Range. In addition, VIP members get access to over 50 VIP-only custom indicators, add-ons, and strategies, private VIP-only forums, private Discord channel to discuss trades and strategies in real-time, customer support, trade alerts, and much more. Learn all about VIP membership here.
How can I access the premium indicators?
To access the premium indicators, which are plug and play ready, sign up for VIP membership here.
Back
Top