


mod note:
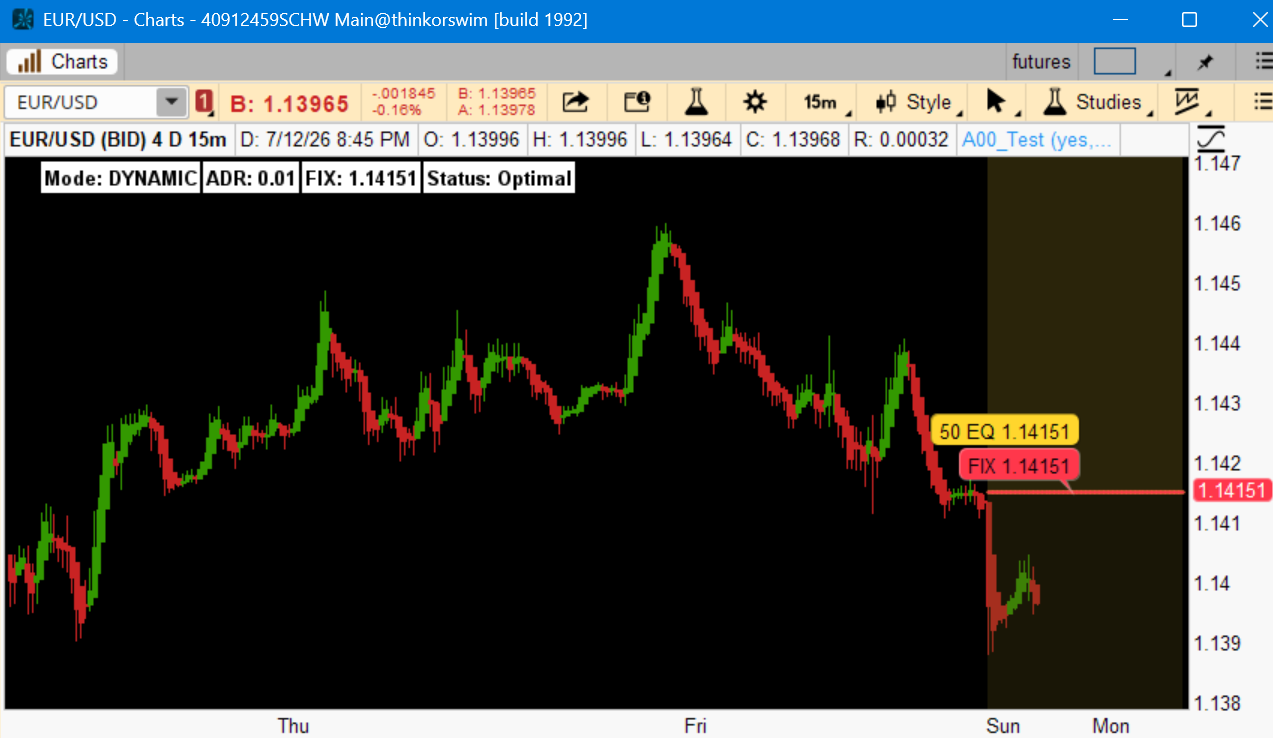
We take inspiration from Nikola Tesla’s obsession with the numbers 3, 6, and 9. This indicator uses those numbers to build a structure that actually makes sense of price movement.
Think of it like a flow chart:
Here are a few favorite quick-play plans:
It gives you:
HTF version found in this post -- repaints
nonpainting version found: https://usethinkscript.com/threads/mtf-goldbach-po3-levels-for-thinkorswim.22561/#post-163537
The Goldbach Indicator: An Overview (The "No-BS" Version)
Based on: Goldbach Fundamentals by Hopiplaka
1. The Big Idea: Markets Have a Mathematical Code
Okay, forget everything you think you know about random price action. The core belief behind this indicator is that the market isn't just chaos. It operates on a hidden mathematical framework.We take inspiration from Nikola Tesla’s obsession with the numbers 3, 6, and 9. This indicator uses those numbers to build a structure that actually makes sense of price movement.
- 3 (Price): Defines the size of the "sandbox" price moves in (Power of Three ranges).
- 6 (Price): Defines the key levels inside that sandbox (Goldbach levels).
- 9 (Time): Defines when the action should happen (Look-back periods & cycles).
2. The "Why Bother?" — What Makes This Indicator Different?
Most indicators are like looking at the market through a foggy window. They show you where price has been. This indicator is like having a roadmap that shows you the hidden highways large institutions are likely using.The Problem it Solves:
- Too Many Lines: Most tools clutter your chart with "analysis paralysis."
- Guessing Support/Resistance: Instead of guessing where to draw a line, this indicator draws them for you, mathematically.
- Missing the Bigger Picture: It combines price and time, so you're not just "buying a level," you're buying a level at the right time.
3. The Core Mechanics: Breaking It Down
Let's look under the hood at how this indicator works. It's basically three parts working together.Part A: The "Sandbox" — Power of Three (PO3) Ranges
First, the indicator figures out the current playing field. It finds the most optimal "Power of Three" range for the asset you're looking at.- Examples: 3, 9, 27, 81, 243, 729 pips/points.
- Why it matters: If you're trading EURUSD, a 243-pip range is a completely different beast than a 27-pip range. The indicator figures out which one is relevant right now.
Part B: The "Zones" — Goldbach Levels
Now, inside that "sandbox," the indicator paints a grid. This grid is based on the Goldbach Conjecture (don't worry, you don't need a math degree to use it).- What it does: It places key levels at specific percentages of the range (3%, 11%, 17%, 29%, 41%, etc.).
- Why it's cool: These levels magically align with what Inner Circle Trader (ICT) folks call "PD Arrays" (Order Blocks, Fair Value Gaps, Liquidity Voids). But unlike the standard ICT approach, these levels aren't drawn arbitrarily; they are mathematically anchored to a specific range.
- 0 & 100: The Range High/Low.
- 3 & 97: The Rejection Block (where price might bounce).
- 11 & 89: The Order Block (entry zone).
- 17 & 83: The Fair Value Gap (price magnet).
- 29 & 71: The Liquidity Void (area of rapid movement).
- 41 & 59: The Breaker (continuation area).
- 47 & 53: The Mitigation Block (equilibrium).
Part C: The "Flow" — The Two Goldbach Algorithms
This is where it gets really interesting. Price doesn't just bounce around randomly between these levels. It follows one of two distinct "algorithms" or paths.Think of it like a flow chart:
- Algorithm 1 (Trending): It usually goes High/Low -> Order Block -> Breaker -> Rejection Block -> FVG -> Liquidity Void.
- Algorithm 2 (Reversal/Continuation): It goes Rejection Block -> Breaker -> FVG -> Order Block -> Mitigation Block -> Liquidity Void.
4. Adding the Time Element: Not Just Where, But When
Having a good level is half the battle. Knowing when price will hit it is the other half.- Goldbach Time: The indicator looks for swing highs and lows that occur at times that add up to Goldbach numbers (like 09:02 = 11). If swing highs are forming at these times but swing lows aren't, it suggests a bearish bias.
- AMD Cycles (Accumulation, Manipulation, Distribution):
- A (Accumulation): The quiet period (usually Asian session). The indicator shows you the range being built.
- M (Manipulation): The "fake-out" or "stop run" period (London session). This is where you want to enter.
- D (Distribution): The move to your target (New York session).
5. What Does the Indicator Actually Look Like on the Chart?
Imagine opening your chart and seeing:- A Big Rectangular Box: This is your optimal PO3 Dealing Range.
- A Grid of Horizontal Lines: These are your Goldbach levels. They're not just random lines—they have names like "OB," "FVG," "LV" to tell you what to expect there.
- A "Story": The indicator helps you see that "price just hit the Order Block, it's rejected, now we expect it to move to the Breaker."
- Time Highlights: Vertical lines or shaded areas marking the key sessions, so you know when to look for your entry.
6. Trade Plans: How to Actually Use It
This isn't just a "here are some lines, good luck" tool. The document provides several concrete strategies.Here are a few favorite quick-play plans:
- The 24-Pip Plan: The ultimate "bread and butter" plan. You look for a PO3 stop run into a Goldbach level during the manipulation phase. Enter with a tight stop and target 24 pips at the next logical Goldbach level.
- The HIPPO Trade Plan: A HIPPO is a "hidden order block" (a 2-bar pattern with two gaps). The plan is to wait for price to trade back into the HIPPO and then ride the move out.
- The "Hidden OTE" Trade Plan: You wait for price to aggressively move away from a Goldbach level, then retrace back into the OTE (Optimal Trade Entry) zone between two specific levels (e.g., 62-79% fib) for a high-probability entry.
- The "Einstein" Trade Plan: A bit of a fun one. It uses the speed of light numbers to define the OB, FVG, and Liquidity Void levels, looking for fast, "energetic" moves.
7. Who's This For?
- For ICT Students: It demystifies the PD Array matrix. It shows you why those levels work and takes the guesswork out of drawing them.
- For the "Math" Trader: If you hate subjective trendlines and want a systematic, repeatable approach, this is for you.
- For Busy Traders: It streamlines your analysis. It's perfect for anyone who wants a clear, uncluttered view of the daily setup.
- For Scalpers & Swingers: It scales. Use it for quick, 20-pip scalps, or use the larger PO3 ranges for long-term swing trades.
8. The Bottom Line
This indicator isn't a magic black box that spits out buy/sell signals. It's an "algorithmic framework" for your eyes. It provides a structured, mathematical way to view the market.It gives you:
- Clarity: No more guesswork on where the key levels are.
- Confluence: Price and time working together.
- A Plan: Clear strategies to follow.
Code:
# Goldbach Po3 Levels
# last day/session levels only
#CANDO13579

declare upper;

input showOnlyLatestDay = yes;

input po3Range = {default PO3_243, PO3_27, PO3_81, PO3_729, Custom};
input customPO3Value = 243.0;
input useDynamicMode = yes;
input useManualFIXPrice = no;
input manualFIXPrice = 0.0;
input fixPriceOffset = 0.0;

input showLabels = yes;
input BubbleOffsetBars = 8;
input showPDAreas = yes;
input showEquilibrium = yes;
input showPriceOnLabels = yes;

input showNonGoldbachLevels = no;
input showMidpointLevels = no;
input showInvertedGoldbach = no;
input showPO3StopRuns = yes;
input stopRunSize = {default PO3_2, PO3_1, PO3_3};
input showPO3STDVLevels = yes;
input stdvInterval = 81.0;

input autoCalculatePO3 = yes;
input adrLength = 20;
input showInfoBox = yes;

input autoDetectSettlementTime = yes;
input settlementHourEST = 16;
input settlementMinute = 0;

input fixLineWidth = 2;
input premiumLineWidth = 1;
input discountLineWidth = 1;
input boundaryLineWidth = 2;

input showTradeSignals = yes;
input showTradeBubbles = yes;
input useTradeSessionFilter = yes;
input tradeStartTime = 0930;
input tradeEndTime = 1130;
input sweepBufferPoints = 1.0;
input riskReward = 2.0;
input stopBufferPoints = 1.5;

DefineGlobalColor("FIX", CreateColor(255, 55, 75));
DefineGlobalColor("Premium", CreateColor(33, 150, 243));
DefineGlobalColor("Discount", CreateColor(255, 145, 0));
DefineGlobalColor("Equilibrium", CreateColor(255, 214, 45));
DefineGlobalColor("NonGoldbach", CreateColor(130, 132, 145));
DefineGlobalColor("Midpoint", Color.WHITE);
DefineGlobalColor("Fire", CreateColor(255, 50, 70));
DefineGlobalColor("StopRun", CreateColor(220, 40, 255));
DefineGlobalColor("STDV", CreateColor(0, 188, 212));
DefineGlobalColor("Inverted", CreateColor(145, 110, 220));
DefineGlobalColor("Premium_Trans1", CreateColor(140, 120, 35));
DefineGlobalColor("Premium_Trans2", CreateColor(85, 75, 20));

def na = Double.NaN;

def latestDate = HighestAll(if !IsNaN(close) then GetYYYYMMDD() else 0);
def showLatest = if showOnlyLatestDay then GetYYYYMMDD() == latestDate else yes;

def dailyHigh = high(period = AggregationPeriod.DAY);
def dailyLow  = low(period = AggregationPeriod.DAY);
def adr = Average(dailyHigh - dailyLow, adrLength);

def autoPO3 =
    if adr <= 27 then 27
    else if adr <= 81 then 81
    else if adr <= 243 then 243
    else if adr <= 729 then 729
    else 2187;

def manualPO3 =
    if po3Range == po3Range.PO3_27 then 27
    else if po3Range == po3Range.PO3_81 then 81
    else if po3Range == po3Range.PO3_243 then 243
    else if po3Range == po3Range.PO3_729 then 729
    else customPO3Value;

def po3 = if autoCalculatePO3 then autoPO3 else manualPO3;

def settleTime =
    if autoDetectSettlementTime then 1600
    else settlementHourEST * 100 + settlementMinute;

def isSettleBar =
    SecondsFromTime(settleTime) >= 0 and
    SecondsFromTime(settleTime)[1] < 0;

rec capturedFIX =
    if BarNumber() == 1 then close
    else if isSettleBar then close
    else capturedFIX[1];

def fixPrice =
    if useManualFIXPrice and manualFIXPrice != 0
    then manualFIXPrice + fixPriceOffset
    else capturedFIX + fixPriceOffset;

def rangeLow =
    if useDynamicMode
    then fixPrice - po3 / 2
    else Floor(close / po3) * po3;

def rangeHigh =
    if useDynamicMode
    then fixPrice + po3 / 2
    else rangeLow + po3;

def eq = (rangeHigh + rangeLow) / 2;

script GBLevel {
    input lowBase = 0.0;
    input po3Size = 243.0;
    input pct = 50.0;
    plot level = lowBase + po3Size * pct / 100;
}

def L003 = GBLevel(rangeLow, po3, 3);
def L011 = GBLevel(rangeLow, po3, 11);
def L017 = GBLevel(rangeLow, po3, 17);
def L029 = GBLevel(rangeLow, po3, 29);
def L041 = GBLevel(rangeLow, po3, 41);
def L047 = GBLevel(rangeLow, po3, 47);
def L053 = GBLevel(rangeLow, po3, 53);
def L059 = GBLevel(rangeLow, po3, 59);
def L071 = GBLevel(rangeLow, po3, 71);
def L083 = GBLevel(rangeLow, po3, 83);
def L089 = GBLevel(rangeLow, po3, 89);
def L097 = GBLevel(rangeLow, po3, 97);

def L023 = GBLevel(rangeLow, po3, 23);
def L035 = GBLevel(rangeLow, po3, 35);
def L065 = GBLevel(rangeLow, po3, 65);
def L077 = GBLevel(rangeLow, po3, 77);

plot High100 = if showLatest then rangeHigh else na;
High100.SetDefaultColor(GlobalColor("Premium"));
High100.SetLineWeight(boundaryLineWidth);

plot Low000 = if showLatest then rangeLow else na;
Low000.SetDefaultColor(GlobalColor("Discount"));
Low000.SetLineWeight(boundaryLineWidth);

plot FIX = if showLatest then fixPrice else na;
FIX.SetDefaultColor(GlobalColor("FIX"));
FIX.SetLineWeight(fixLineWidth);

plot EQ50 = if showLatest and showEquilibrium then eq else na;
EQ50.SetDefaultColor(GlobalColor("Equilibrium"));
EQ50.SetLineWeight(2);

plot D003 = if showLatest then L003 else na;
D003.SetDefaultColor(GlobalColor("Discount"));
D003.SetStyle(Curve.SHORT_DASH);
D003.SetLineWeight(discountLineWidth);

plot D011 = if showLatest then L011 else na;
D011.SetDefaultColor(GlobalColor("Discount"));
D011.SetStyle(Curve.SHORT_DASH);
D011.SetLineWeight(discountLineWidth);

plot D017 = if showLatest then L017 else na;
D017.SetDefaultColor(GlobalColor("Discount"));
D017.SetStyle(Curve.SHORT_DASH);
D017.SetLineWeight(discountLineWidth);

plot D029 = if showLatest then L029 else na;
D029.SetDefaultColor(GlobalColor("Fire"));
D029.SetStyle(Curve.SHORT_DASH);
D029.SetLineWeight(discountLineWidth);

plot D041 = if showLatest then L041 else na;
D041.SetDefaultColor(GlobalColor("Discount"));
D041.SetStyle(Curve.SHORT_DASH);
D041.SetLineWeight(discountLineWidth);

plot D047 = if showLatest then L047 else na;
D047.SetDefaultColor(GlobalColor("Discount"));
D047.SetStyle(Curve.SHORT_DASH);
D047.SetLineWeight(discountLineWidth);

plot P053 = if showLatest then L053 else na;
P053.SetDefaultColor(GlobalColor("Premium"));
P053.SetStyle(Curve.SHORT_DASH);
P053.SetLineWeight(premiumLineWidth);

plot P059 = if showLatest then L059 else na;
P059.SetDefaultColor(GlobalColor("Premium"));
P059.SetStyle(Curve.SHORT_DASH);
P059.SetLineWeight(premiumLineWidth);

plot P071 = if showLatest then L071 else na;
P071.SetDefaultColor(GlobalColor("Fire"));
P071.SetStyle(Curve.SHORT_DASH);
P071.SetLineWeight(premiumLineWidth);

plot P083 = if showLatest then L083 else na;
P083.SetDefaultColor(GlobalColor("Premium"));
P083.SetStyle(Curve.SHORT_DASH);
P083.SetLineWeight(premiumLineWidth);

plot P089 = if showLatest then L089 else na;
P089.SetDefaultColor(GlobalColor("Premium"));
P089.SetStyle(Curve.SHORT_DASH);
P089.SetLineWeight(premiumLineWidth);

plot P097 = if showLatest then L097 else na;
P097.SetDefaultColor(GlobalColor("Premium"));
P097.SetStyle(Curve.SHORT_DASH);
P097.SetLineWeight(premiumLineWidth);

plot NG23 = if showLatest and showNonGoldbachLevels then L023 else na;
NG23.SetDefaultColor(GlobalColor("NonGoldbach"));
NG23.SetStyle(Curve.SHORT_DASH);

plot NG35 = if showLatest and showNonGoldbachLevels then L035 else na;
NG35.SetDefaultColor(GlobalColor("NonGoldbach"));
NG35.SetStyle(Curve.SHORT_DASH);

plot NG65 = if showLatest and showNonGoldbachLevels then L065 else na;
NG65.SetDefaultColor(GlobalColor("NonGoldbach"));
NG65.SetStyle(Curve.SHORT_DASH);

plot NG77 = if showLatest and showNonGoldbachLevels then L077 else na;
NG77.SetDefaultColor(GlobalColor("NonGoldbach"));
NG77.SetStyle(Curve.SHORT_DASH);

plot INV14 = if showLatest and showInvertedGoldbach then GBLevel(rangeLow, po3, 14) else na;
INV14.SetDefaultColor(GlobalColor("Inverted"));
INV14.SetStyle(Curve.LONG_DASH);

plot INV32 = if showLatest and showInvertedGoldbach then GBLevel(rangeLow, po3, 32) else na;
INV32.SetDefaultColor(GlobalColor("Inverted"));
INV32.SetStyle(Curve.LONG_DASH);

plot INV38 = if showLatest and showInvertedGoldbach then GBLevel(rangeLow, po3, 38) else na;
INV38.SetDefaultColor(GlobalColor("Inverted"));
INV38.SetStyle(Curve.LONG_DASH);

plot INV56 = if showLatest and showInvertedGoldbach then GBLevel(rangeLow, po3, 56) else na;
INV56.SetDefaultColor(GlobalColor("Inverted"));
INV56.SetStyle(Curve.LONG_DASH);

plot INV74 = if showLatest and showInvertedGoldbach then GBLevel(rangeLow, po3, 74) else na;
INV74.SetDefaultColor(GlobalColor("Inverted"));
INV74.SetStyle(Curve.LONG_DASH);

plot INV79 = if showLatest and showInvertedGoldbach then GBLevel(rangeLow, po3, 79) else na;
INV79.SetDefaultColor(GlobalColor("Inverted"));
INV79.SetStyle(Curve.LONG_DASH);

plot INV92 = if showLatest and showInvertedGoldbach then GBLevel(rangeLow, po3, 92) else na;
INV92.SetDefaultColor(GlobalColor("Inverted"));
INV92.SetStyle(Curve.LONG_DASH);

plot INV95 = if showLatest and showInvertedGoldbach then GBLevel(rangeLow, po3, 95) else na;
INV95.SetDefaultColor(GlobalColor("Inverted"));
INV95.SetStyle(Curve.LONG_DASH);

plot INV98 = if showLatest and showInvertedGoldbach then GBLevel(rangeLow, po3, 98) else na;
INV98.SetDefaultColor(GlobalColor("Inverted"));
INV98.SetStyle(Curve.LONG_DASH);

plot MID07 = if showLatest and showMidpointLevels then GBLevel(rangeLow, po3, 7) else na;
MID07.SetDefaultColor(GlobalColor("Midpoint"));
MID07.SetStyle(Curve.LONG_DASH);

plot MID20 = if showLatest and showMidpointLevels then GBLevel(rangeLow, po3, 20) else na;
MID20.SetDefaultColor(GlobalColor("Midpoint"));
MID20.SetStyle(Curve.LONG_DASH);

plot MID44 = if showLatest and showMidpointLevels then GBLevel(rangeLow, po3, 44) else na;
MID44.SetDefaultColor(GlobalColor("Midpoint"));
MID44.SetStyle(Curve.LONG_DASH);

plot MID50 = if showLatest and showMidpointLevels then GBLevel(rangeLow, po3, 50) else na;
MID50.SetDefaultColor(GlobalColor("Midpoint"));
MID50.SetStyle(Curve.LONG_DASH);

plot MID56 = if showLatest and showMidpointLevels then GBLevel(rangeLow, po3, 56) else na;
MID56.SetDefaultColor(GlobalColor("Midpoint"));
MID56.SetStyle(Curve.LONG_DASH);

plot MID80 = if showLatest and showMidpointLevels then GBLevel(rangeLow, po3, 80) else na;
MID80.SetDefaultColor(GlobalColor("Midpoint"));
MID80.SetStyle(Curve.LONG_DASH);

plot MID93 = if showLatest and showMidpointLevels then GBLevel(rangeLow, po3, 93) else na;
MID93.SetDefaultColor(GlobalColor("Midpoint"));
MID93.SetStyle(Curve.LONG_DASH);

def srDiv =
    if stopRunSize == stopRunSize.PO3_1 then 1
    else if stopRunSize == stopRunSize.PO3_2 then 2
    else 3;

def srUpper = rangeHigh + po3 / srDiv;
def srLower = rangeLow - po3 / srDiv;

plot UpperSR = if showLatest and showPO3StopRuns then srUpper else na;
UpperSR.SetDefaultColor(GlobalColor("StopRun"));
UpperSR.SetStyle(Curve.LONG_DASH);
UpperSR.SetLineWeight(3);

plot LowerSR = if showLatest and showPO3StopRuns then srLower else na;
LowerSR.SetDefaultColor(GlobalColor("StopRun"));
LowerSR.SetStyle(Curve.LONG_DASH);
LowerSR.SetLineWeight(3);

plot STDV_U1 = if showLatest and showPO3STDVLevels then fixPrice + stdvInterval else na;
STDV_U1.SetDefaultColor(GlobalColor("STDV"));
STDV_U1.SetStyle(Curve.SHORT_DASH);

plot STDV_U2 = if showLatest and showPO3STDVLevels then fixPrice + stdvInterval * 2 else na;
STDV_U2.SetDefaultColor(GlobalColor("STDV"));
STDV_U2.SetStyle(Curve.SHORT_DASH);

plot STDV_U3 = if showLatest and showPO3STDVLevels then fixPrice + stdvInterval * 3 else na;
STDV_U3.SetDefaultColor(GlobalColor("STDV"));
STDV_U3.SetStyle(Curve.SHORT_DASH);

plot STDV_D1 = if showLatest and showPO3STDVLevels then fixPrice - stdvInterval else na;
STDV_D1.SetDefaultColor(GlobalColor("STDV"));
STDV_D1.SetStyle(Curve.SHORT_DASH);

plot STDV_D2 = if showLatest and showPO3STDVLevels then fixPrice - stdvInterval * 2 else na;
STDV_D2.SetDefaultColor(GlobalColor("STDV"));
STDV_D2.SetStyle(Curve.SHORT_DASH);

plot STDV_D3 = if showLatest and showPO3STDVLevels then fixPrice - stdvInterval * 3 else na;
STDV_D3.SetDefaultColor(GlobalColor("STDV"));
STDV_D3.SetStyle(Curve.SHORT_DASH);

AddCloud(if showLatest and showPDAreas then rangeHigh else na,
         if showLatest and showPDAreas then eq else na,
         GlobalColor("Premium_Trans1"),
         GlobalColor("Premium_Trans1"));

AddCloud(if showLatest and showPDAreas then eq else na,
         if showLatest and showPDAreas then rangeLow else na,
         GlobalColor("Premium_Trans2"),
         GlobalColor("Premium_Trans2"));

def lastBar = !IsNaN(close) and IsNaN(close[-1]);

def bubbleBar =
    IsNaN(close) and
    !IsNaN(close[BubbleOffsetBars]) and
    IsNaN(close[BubbleOffsetBars - 1]);

def bubbleRangeHigh = HighestAll(if lastBar then rangeHigh else na);
def bubbleRangeLow  = HighestAll(if lastBar then rangeLow else na);
def bubbleFixPrice  = HighestAll(if lastBar then fixPrice else na);
def bubbleEQ        = HighestAll(if lastBar then eq else na);

def bubbleL003 = HighestAll(if lastBar then L003 else na);
def bubbleL011 = HighestAll(if lastBar then L011 else na);
def bubbleL017 = HighestAll(if lastBar then L017 else na);
def bubbleL029 = HighestAll(if lastBar then L029 else na);
def bubbleL041 = HighestAll(if lastBar then L041 else na);
def bubbleL047 = HighestAll(if lastBar then L047 else na);
def bubbleL053 = HighestAll(if lastBar then L053 else na);
def bubbleL059 = HighestAll(if lastBar then L059 else na);
def bubbleL071 = HighestAll(if lastBar then L071 else na);
def bubbleL083 = HighestAll(if lastBar then L083 else na);
def bubbleL089 = HighestAll(if lastBar then L089 else na);
def bubbleL097 = HighestAll(if lastBar then L097 else na);

def bubbleL023 = HighestAll(if lastBar then L023 else na);
def bubbleL035 = HighestAll(if lastBar then L035 else na);
def bubbleL065 = HighestAll(if lastBar then L065 else na);
def bubbleL077 = HighestAll(if lastBar then L077 else na);

def bubbleSRUpper = HighestAll(if lastBar then srUpper else na);
def bubbleSRLower = HighestAll(if lastBar then srLower else na);

AddChartBubble(showLabels and bubbleBar, bubbleRangeHigh,
    "100 HIGH " + AsPrice(bubbleRangeHigh), GlobalColor("Premium"), yes);

AddChartBubble(showLabels and bubbleBar, bubbleRangeLow,
    "0 LOW " + AsPrice(bubbleRangeLow), GlobalColor("Discount"), no);

AddChartBubble(showLabels and bubbleBar, bubbleFixPrice,
    "FIX " + AsPrice(bubbleFixPrice), GlobalColor("FIX"), yes);

AddChartBubble(showLabels and showEquilibrium and bubbleBar, bubbleEQ,
    "50 EQ " + AsPrice(bubbleEQ), GlobalColor("Equilibrium"), yes);

AddChartBubble(showLabels and bubbleBar, bubbleL003, "3 REJECTION " + AsPrice(bubbleL003), GlobalColor("Discount"), no);
AddChartBubble(showLabels and bubbleBar, bubbleL011, "11 ORDER BLOCK " + AsPrice(bubbleL011), GlobalColor("Discount"), no);
AddChartBubble(showLabels and bubbleBar, bubbleL017, "17 FVG " + AsPrice(bubbleL017), GlobalColor("Discount"), no);
AddChartBubble(showLabels and bubbleBar, bubbleL029, "29 LIQ VOID " + AsPrice(bubbleL029), GlobalColor("Fire"), no);
AddChartBubble(showLabels and bubbleBar, bubbleL041, "41 BREAKER " + AsPrice(bubbleL041), GlobalColor("Discount"), no);
AddChartBubble(showLabels and bubbleBar, bubbleL047, "47 MITIGATION " + AsPrice(bubbleL047), GlobalColor("Discount"), no);

AddChartBubble(showLabels and bubbleBar, bubbleL053, "53 MITIGATION " + AsPrice(bubbleL053), GlobalColor("Premium"), yes);
AddChartBubble(showLabels and bubbleBar, bubbleL059, "59 BREAKER " + AsPrice(bubbleL059), GlobalColor("Premium"), yes);
AddChartBubble(showLabels and bubbleBar, bubbleL071, "71 LIQ VOID " + AsPrice(bubbleL071), GlobalColor("Fire"), yes);
AddChartBubble(showLabels and bubbleBar, bubbleL083, "83 FVG " + AsPrice(bubbleL083), GlobalColor("Premium"), yes);
AddChartBubble(showLabels and bubbleBar, bubbleL089, "89 ORDER BLOCK " + AsPrice(bubbleL089), GlobalColor("Premium"), yes);
AddChartBubble(showLabels and bubbleBar, bubbleL097, "97 REJECTION " + AsPrice(bubbleL097), GlobalColor("Premium"), yes);

AddChartBubble(showLabels and showNonGoldbachLevels and bubbleBar, bubbleL023,
    "23 NON-GB " + AsPrice(bubbleL023), GlobalColor("NonGoldbach"), no);

AddChartBubble(showLabels and showNonGoldbachLevels and bubbleBar, bubbleL035,
    "35 NON-GB " + AsPrice(bubbleL035), GlobalColor("NonGoldbach"), no);

AddChartBubble(showLabels and showNonGoldbachLevels and bubbleBar, bubbleL065,
    "65 NON-GB " + AsPrice(bubbleL065), GlobalColor("NonGoldbach"), yes);

AddChartBubble(showLabels and showNonGoldbachLevels and bubbleBar, bubbleL077,
    "77 NON-GB " + AsPrice(bubbleL077), GlobalColor("NonGoldbach"), yes);

AddChartBubble(showLabels and showPO3StopRuns and bubbleBar, bubbleSRUpper,
    "SR " + AsPrice(bubbleSRUpper), GlobalColor("StopRun"), yes);

AddChartBubble(showLabels and showPO3StopRuns and bubbleBar, bubbleSRLower,
    "SR " + AsPrice(bubbleSRLower), GlobalColor("StopRun"), no);

def inTradeWindow =
    SecondsFromTime(tradeStartTime) >= 0 and
    SecondsTillTime(tradeEndTime) >= 0;

def canTrade = if useTradeSessionFilter then inTradeWindow else yes;

def bullSweep03 = low < L003 - sweepBufferPoints and close > L003;
def bullSweep11 = low < L011 - sweepBufferPoints and close > L011;
def bullSweep17 = low < L017 - sweepBufferPoints and close > L017;

def bearSweep97 = high > L097 + sweepBufferPoints and close < L097;
def bearSweep89 = high > L089 + sweepBufferPoints and close < L089;
def bearSweep83 = high > L083 + sweepBufferPoints and close < L083;

def bullSignal = showLatest and showTradeSignals and canTrade and (bullSweep03 or bullSweep11 or bullSweep17);
def bearSignal = showLatest and showTradeSignals and canTrade and (bearSweep97 or bearSweep89 or bearSweep83);

def bullStop = Min(low, close) - stopBufferPoints;
def bearStop = Max(high, close) + stopBufferPoints;

def bullRisk = close - bullStop;
def bearRisk = bearStop - close;

def bullTarget = close + bullRisk * riskReward;
def bearTarget = close - bearRisk * riskReward;

plot GB_Long = bullSignal;
GB_Long.SetPaintingStrategy(PaintingStrategy.BOOLEAN_ARROW_UP);
GB_Long.SetDefaultColor(Color.GREEN);
GB_Long.SetLineWeight(4);

plot GB_Short = bearSignal;
GB_Short.SetPaintingStrategy(PaintingStrategy.BOOLEAN_ARROW_DOWN);
GB_Short.SetDefaultColor(Color.RED);
GB_Short.SetLineWeight(4);

AddLabel(showInfoBox, "Mode: " + if useDynamicMode then "DYNAMIC" else "FIXED", Color.WHITE);
AddLabel(showInfoBox, "ADR: " + Round(adr, 2), Color.WHITE);
AddLabel(showInfoBox, "FIX: " + AsPrice(fixPrice), Color.WHITE);
#AddLabel(showInfoBox, "Latest Day Only: " + if showOnlyLatestDay then "ON" else "OFF", Color.WHITE);
AddLabel(showInfoBox, "Status: Optimal", Color.WHITE);
Last edited by a moderator:
 INDICATOR DESCRIPTION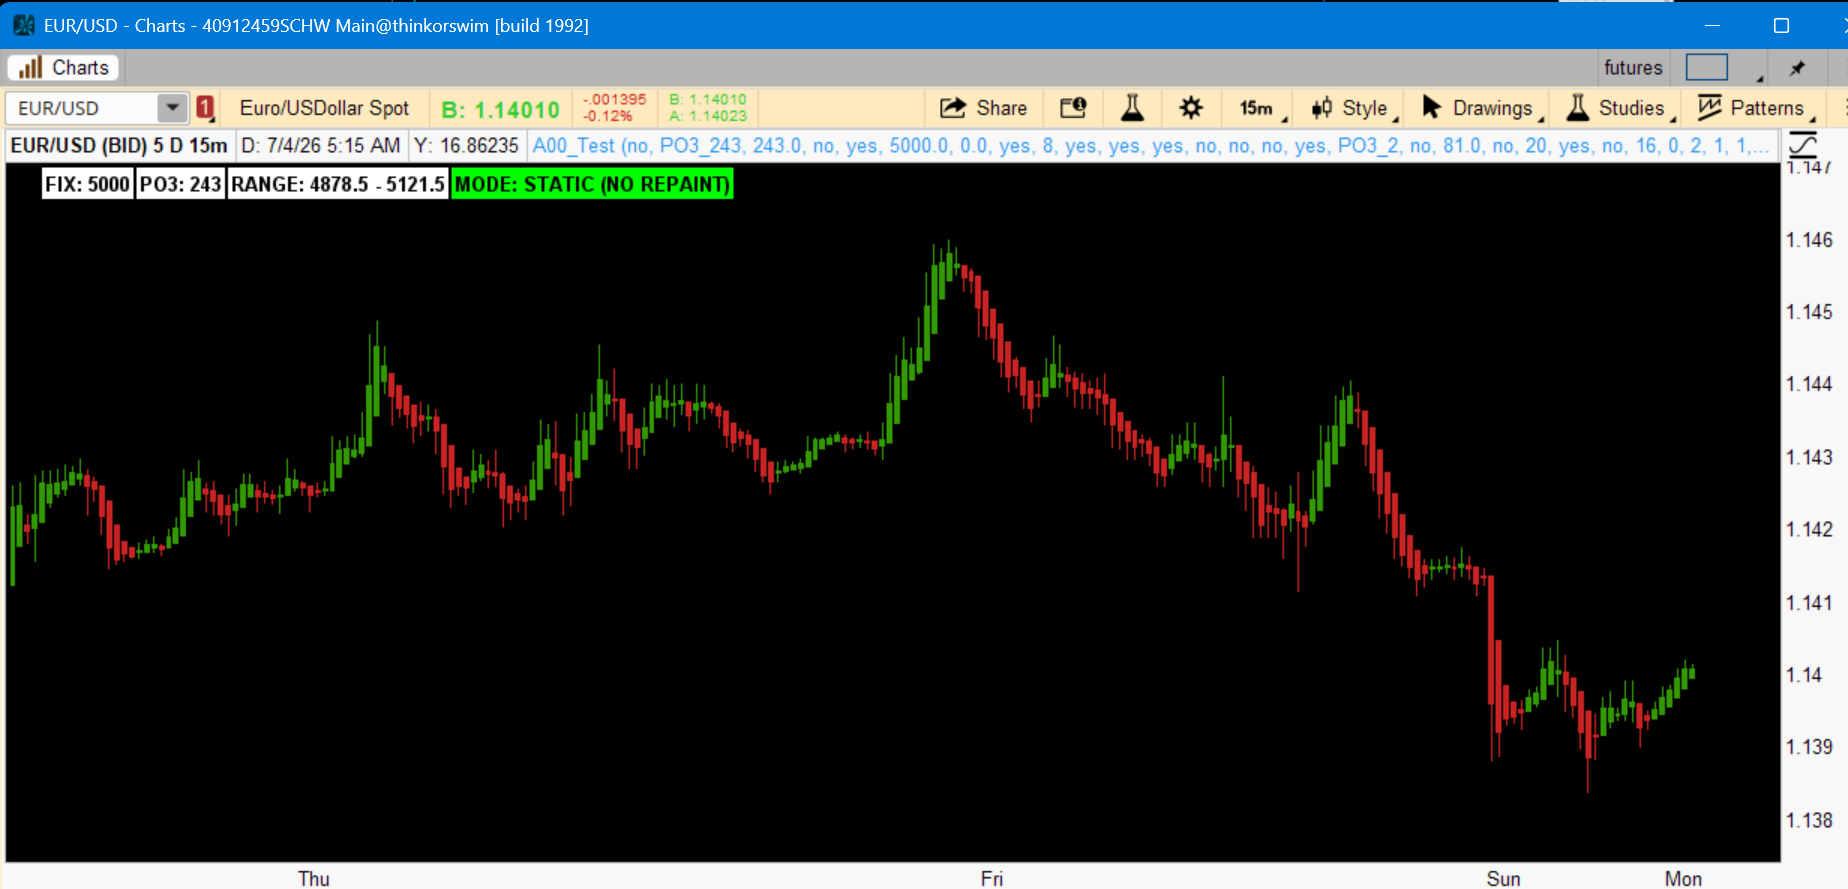
 YOUR DAILY JOB (1 Minute)
 WHAT YOU GET
 WHAT YOU DON'T HAVE TO WORRY ABOUT
 No settlement time detection


